Reports: UR1057010-UR10: Green Gold Nanoparticles for Catalytic Reduction of Nitrophenols
 printer friendly
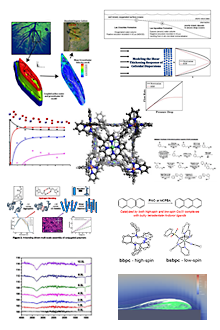
With the increasing applications of nano-gold catalysts for numerous industrial applications, we have designed and synthesized gold nanoparticles (AuNPs) in the size range of 10± 5 nm using a single-step green process. We have utilized the combined reducing/capping ability of naturally available saccharides like fructose (Fru), sucrose (Suc), and raffinose (Raf) to synthesize saccharide conjugated nanoparticles (Sac-AuNP) [Fig. 1]. Using these Sac-AuNPs we evaluated and compared the catalytic properties of saccharide conjugated AuNPs (including Fru-AuNPs, Suc-AuNPs and Raf-AuNPs), using a model reaction system based on the reduction of p-nitrophenolate in presence of sodium borohydride (NaBH4) [Fig. 2]. Using the kinetic data obtained from the spectroscopic measurements at three different temperatures (10 °C, 25 °C and 45 °C), we calculated the average rate constant (k), activation energy (Ea), and pre-exponential factor (A) for each type of saccharide conjugated AuNPs. The results indicated Fru-AuNPs to be highly catalytically active in comparison to Suc-AuNPs and Raf-AuNPs, which can be attributed to the availability of greater active surface area for catalysis due to the small size of the ligand. The average rate constant values were found to be in descending order as, Fru-AuNPs, Suc-AuNPs, and Raf-AuNPs. Whereas, the order of activation energy (Ea) was, in ascending order, Fru-AuNPs, Suc-AuNPs, Raf-AuNPs respectively [Table 1]. In conclusion, our studies elucidate the relationship between the size of the conjugated ligand and the catalytic activity of the resultant saccharide conjugated AuNPs (Sac-AuNP) as inversely proportional. Our future research will be focused on large scale preparation and characterization of other saccharide coated gold nanoparticles (GNPs) in a simple and an environmentally manner that will be demonstrated to be suitable for the catalytic application to reduce nitrophenol to produce aminophenol.
The professional research activity of the PI has tremendously benefited from this grant. Students synthesized three different Sac-GNPs and characterized them. Students gained firsthand experience in learning and using several analytical techniques including TEM. These students will be presenting at state and national conferences including American Chemical Society Annual meetings in the coming year. Students will also be co-authors in publications appearing in peer-reviewed journals.
Figure 1. Illustration of the morphological and size characterization of synthesized Sac-AuNPs through TEM, UV-Vis, and DLS analysis. (a) TEM image showing formation of well-dispersed spherical Fru-AuNPs with a core size range of 15 ± 5 nm. DLS analysis depicts the hydrodynamic radius as 30 ± 10 nm, which correlates with the SPR event observed in the UV-Vis. (b) TEM image showing formation of well-dispersed spherical Suc-AuNPs with a core size range of 15 ± 5 nm. DLS analysis depicts the hydrodynamic radius as 12 ± 3 nm, which correlates with the SPR event observed in the UV-Vis. (c) TEM image showing formation of well-dispersed spherical Raf-AuNPs with a core size range of 10 ± 5 nm. DLS analysis depicts the hydrodynamic radius as 12 ± 3 nm, which correlates with the SPR event observed in the UV-Vis.
Figure 2. UV-Visible spectroscopic time scan analysis. In each spectrograph, representing the reduction assay of 4-nitrophenol in each respective Sac-AuNP at all three temperature variations, the extinction of the 400 nm peak is utilized as an indicator of the reaction progress for catalytic activity determination. As the reactions temperature increases, the tabs decreases and the reaction reaches equilibrium at a greater pace as indicative across the 10 °C (a), 25 °C (b), and 45 °C (c) spectrographs.’
Type of Sac-AuNP |
Rate Constant (s-1) |
Activation Energy (kJ mol-1) |
Pre-Exponential Factor A (s-1) |
||
10 °C |
25 °C |
45 °C |
|||
Fru-AuNP |
4.42 ± 0.063 |
5.27 ± 0.024 |
5.95 ± 0.016 |
17.12 ± 0.77 |
234.71 |
Suc-AuNP |
4.27 ± 0.035 |
4.83 ± 0.038 |
5.24 ± 0.068 |
31.32 ± 1.39 |
2982.53 |
Raf-AuNP |
3.63 ± 0.028 |
3.82 ± 0.029 |
4.06 ± 0.014 |
40.50 ± 1.28 |
7151.28 |
Table 1. Illustration of the pseudo-first order rate constants (k’) of each Sac-AuNPs at 10 °C, 25 °C, and 45 °C. Additionally the interpolated activation energy (Ea) and pre-exponential factor (A), which were calculated from the reaction rate and temperature relationship, are included for all Sac-AuNP samples.