Reports: DNI1052640-DNI10: Stabilized Nanoparticle Partitioning and Interfacial Behavior in Oil-Brine Systems
 printer friendly
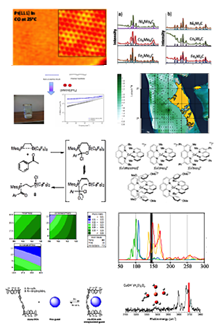
Year 2 Progress Overview. Expanded libraries of water stabilized, engineered nanoparticles were further developed with defined size, shape, compositions, and variable surface coatings. The material library includes: monodispersed, single domain, Fe3O4 (magnetite) nanocystals (T2 active) with specific sizes of 8-27 nm and shape (spherical, cube and octahedral); Single domain, monodispersed manganese oxide (Mn3O4) nanocrystals (T1 active) with specific sizes of 6-25 nm (spherical) (Figure 1); 9-10 nm, monodispersed mixed ferrite nanocrystals (T1/T2 active) with varying iron:manganese ratios (9:1 – 1:9 Fe-Ox/Mn-Ox, Figure 2); 'hollow' monodispersed, shell- metal oxide, structures (newly developed); and core-shell Fe3O4 (magnetite) nanocystals coated with a Mn ferrite layer (newly developed, Figure 3), which provide a unique and direct avenue to explore enhanced surface energies, differential magnetic response and material density profiles. Methods are available upon request and/or as described in the project proposal. A number of surface coating strategies, including bi- and single-layers, were explored and optimized for (particle) aqueous transfer. Characterization of water stable material behavior(s) included oil-water partitioning measurements, quartz crystal microbalance (surface deposition) measurements, in addition to aggregation behavior in salt waters of various ionic strength and types.
Highlighted Results. The stability of single crystal MnO particles which were stabilized via a number of surface coating strategies in water (7.5 mg/L) were evaluated in the presence of varied ionic strength (varied by concentration and type, NaCl and CaCl2) via the tendency of particles to aggregate. Results are shown and described in Figure 4 Figure 1. TEM micrographs of manganese oxide nanocrystals. The high concentration of manganese oleate (Mn-Ol) increases the diameters of the nanocrystalline manganese oxides. The diameters of manganese oxide nanocrystals are 12.2 ± 1.2 nm (0.5 M of manganese oleate), 18.7 ± 2.8 nm (1.0 M of manganese oleate), and 27.9 ± 2.8 nm (1.5 M of manganese oleate) from left to right. Different concentration of manganese oleate was decomposed in octadecene in the presence of 2 mmol of oleic acid at 320 oC for 1h. The average diameters of the nanocrystals were analyzed by counting over 1000 particles using Image-Pro plus 6 (Figure S2). All scale bars are 50 nm
Figure 2. Monodisperse MnFe2O4 ferrite nanocrsytals. The diameter of the nanocrystalline MnFe2O4 is 11.0 ± 1.0 nm measured by counting over 1000 nanoparticles using Image-Pro plus 6 (A). Gatan Image Filter (GIF) analysis shows the mapping position of two different metals, iron (B, Red) and manganese (C, green), is identical in the same spherical nanocrystal (D, mixed with red and green).
Figure 3. HRTEM (top left) and GIF TEM micrographs of magnetite – ferrite core shell nanoparticles.
Figure 4. Attachment efficiency (α) as a function of CaCl concentrations for both bilayered- (A for oleyl phosphate coated-, B for octadecyl phosphonicacid coated-, C for oleic acid coated-, D for stearic acid coated-manganese oxides) and pegylated-manganese oxide nanocrystals (E) and the aggregation kinetic example of PEGylated manganese oxide nanocrystals also as a function of CaCl2 concentration. The attachment efficiency (α) for each nanocrystal sample was calculated by measuring the aggregation rates of the particles as a function of time and salt concentrations (F). The nanocrystal concentration employed was 7.5 mg/L. The depicted images showed the bilayered and single layered surface coating structures. The critical coagulation concentrations were 19.1 mM of CaCl2 for oleyl phosphate coated- (A), 2.7 mM of CaCl2 for octadecylphosphonic acid coated- (B), 19.2 mM of CaCl2 for oleic acid coated- (C), and 5.8 mM of CaCl2 for stearic acid coated- bilayered manganese oxide nanocrystals (D). The critical coagulation concentrations for PEG 200 coated manganese oxide nanocrystals was 6.8 mM of CaCl2 (E).
Figure 5. Attachment efficiency (α) as a function of mono-/di- valent salt concentrations (NaCl (blue) and CaCl2 (red)) for both bilayered- and pegylated- MnFe2O4 (11 nm, Figure 2) nanocrystals. The attachment efficiency (α) for each nanocrystal sample was calculated by measuring the aggregation rates of the particles (7.5 mg/l) as a function of time and salt concentrations. The inset image shows nanocrystal aggregation at high ionic strength conditions.
Figure 6. SQUID magnetometry results for 11-12 particles, as described, with no coating. Fe3O4 (black) and core-shell (red) materials displayed superparamagnetic properties.