Reports: DNI753243-DNI7: Identifying Molecular Structures of Polymers with Asymptotic Nonlinear Shear Rheology
 printer friendly
The first year focused on the important problem of fitting model parameters to data and selecting a model to fit the data. By definition, such a problem is ill-posed. For model parameter fitting, we observe that more modes are needed to fit nonlinearities compared to linear data (G' and G"). For one dataset, five modes are required for nonlinearities compared to three for linear data. Moreover, for any number of modes, fitting all four nonlinear signals is the best scheme (rather than fitting a single nonlinearity or a combined measure of nonlinearity). Additionally, the PI is collaborated with a colleague to develop a Bayesian inference technique for rheological model selection.
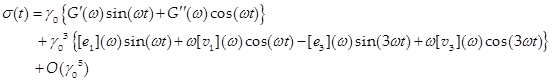
For a material under large amplitude oscillatory strain (LAOS) where the strain signal is sinusoidal, the time dependent stress response is:1
 (1)
(1)
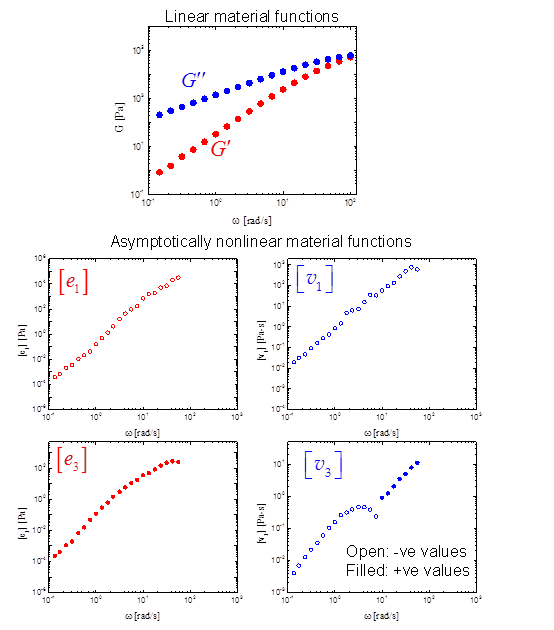
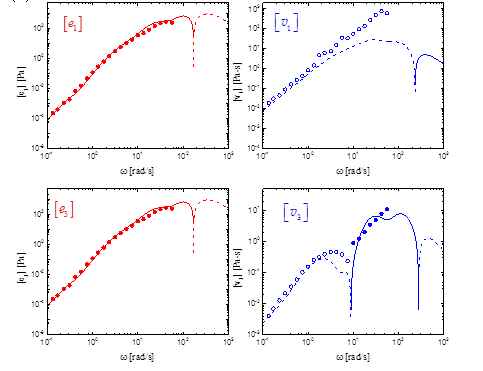
In addition to the two well-known linear viscoelastic (LVE) moduli, we get four additional asymptotically-nonlinear material functions: [e1], [e3], [v1], [v3]. Figure 1 shows the results of measuring the two linear and four nonlinear properties for a 1,4-polyisoprene melt.
Several techniques for calculating the linear relaxation spectrum {Gi,
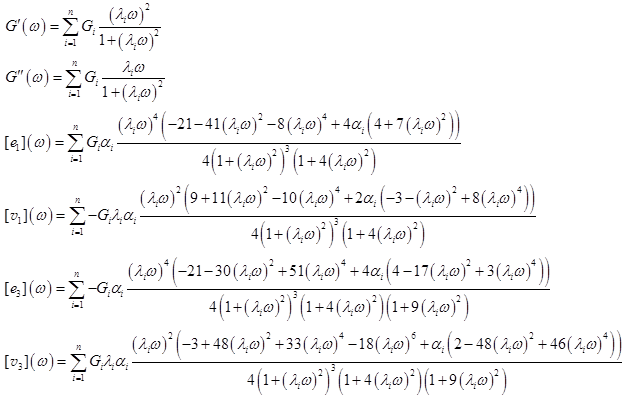
We consider fitting the nonlinear measures using a multi-mode Giesekus model,4 which is widely used to model both extension and shear rheology. The nonlinear parameter a is known as the mobility factor, associated with molecular features (drag anisotropy when stretched) and ranging from 0 to 1. For an n-mode Giesekus model, the LAOS material functions are known:5
 (4)
(4)
First, we determine the relaxation spectrum {Gi,
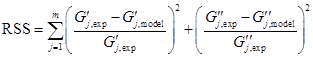
The linear relaxation spectrum is calculated by minimizing the residual sum of squares (RSS) using nonlinear regression. We define RSS as:
 (5)
(5)
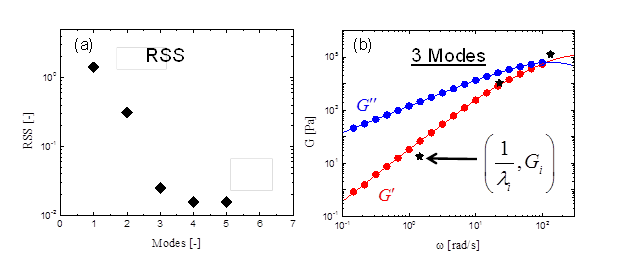
where m is the number of experimental data points and j represents a particular data point. The parsimonious spectrum2a which fits the data best with the least number of modes is selected by observing the plateau in RSS versus the number of modes plot, as shown in figure 2. In this case, the optimum is n=3 modes.
For the nonlinear data fit, two questions arise: 1) What fitting scheme to use? Fit all nonlinearities together or fit only one? 2) What is the optimum number of modes?
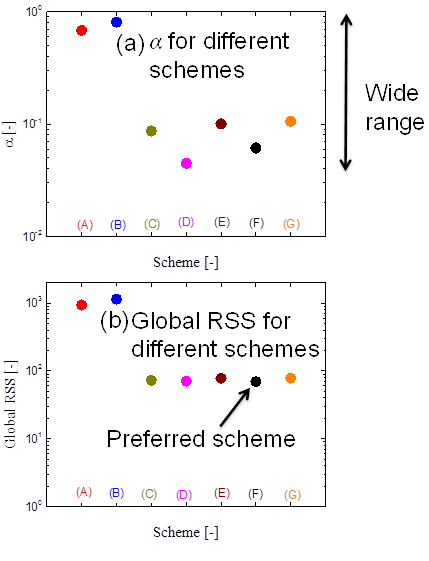
To answer the first question, we consider the single mode case and fit the value of a using 7 different schemes as shown in figure 3(a). Schemes (A)-(D) are single material function fits, (E) uses a lumped third harmonic measure ![]() , (F) fits all four nonlinearities together and (G) uses a measure
, (F) fits all four nonlinearities together and (G) uses a measure ![]() (used in literature). The fitting is based on the minimization of local RSS while a comparison between different schemes is based on a global RSS.
(used in literature). The fitting is based on the minimization of local RSS while a comparison between different schemes is based on a global RSS.
From Figure 3(a), the fit of the nonlinear parameter a is scattered over two decades between 0.04 and 0.80. This raises the question of which scheme is best? Based on the minimization of global RSS, scheme (F) is the best as shown in figure 3(b). For the subsequent analysis while varying the number of modes, we use only scheme (F): fitting all nonlinearities together.
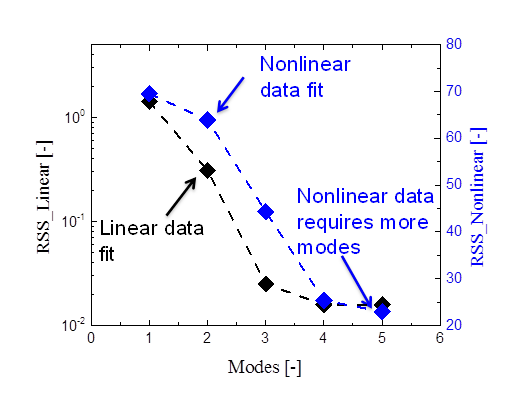
Figure 4 shows that the nonlinear data require more modes to reach a plateau in the RSS error. While the optimum number of modes for fitting linear data is 3, the optimum number of modes for fitting nonlinear data seems to be 5. This is in contrast to the common approach in literature where the number of modes for nonlinear data is assumed to be the same as the optimum number of modes for linear data.
Figure 5 shows the five-mode fit to the nonlinear signals. We are currently working on finding the reason for the requirement of more modes for nonlinear data.
These results for model selection and parameter calibration are fundamental to inferring molecular features (or fitting any model parameters) to rheological data, both linear and nonlinear. After establishing this protocol, we will consider structure-rheology constitutive equations that contain molecular information in their calibration parameters, in particular identifying the uncertainty of these molecular features inferred from macroscopic rheological characterization.
This funding has allowed the PI to support one graduate student and also supported time for himself to collaborate with a colleague. The student has thrived with this funding, having already presented this work as a poster at The Society of Rheology Annual Meeting (October 2014, Philadelphia, PA).
1. Ewoldt &Bharadwaj, Rheol Acta 2013
2. (a) Baumgaertel &Winter. J.Non-Newtonian Fluid Mechanics 1992; (b) Cho &Park, J.Rheology 2013; (c) Stadler & Bailly, Rheol Acta 2009; (d) Weese, Computer-Physics-Communications 1993.
3. Bharadwaj &Ewoldt J.Rheology 2014
4. (a) Calin, Wilhelm, Balan, J.Non-Newtonian Fluid Mechanics 2010; (b) Giesekus, J.Non-Newtonian Fluid Mechanics 1982.
Fig. 1 Experimental measurements of the two linear and four asymptotically-nonlinear material functions on 1,4-polyisoprene melt
Fig. 2 (a) RSS error for the linear data fit as a function of the number of modes. (b) Best fit curves and the associated relaxation spectrum (symbols: star) for the three modes case
Fig. 3 (a) Best fit values of a based on different schemes. (b) Global RSS for the various schemes. Schemes use different signals for fitting: (A) [e1] only, (B): [v1], (C) [e3], (D) [v3], (E) [I3], (F) All nonlinearities, (G) Q0.
Fig. 4 RSS error plateaus at large number of modes for nonlinear data (right axis) compared to linear data (left axis).
Fig. 5 Best fit curves for five-mode Giesekus model to data in Figure 1 (a1=0.013, a2=0.196, a3=0.103, a4=0.284, a5=0.223).