Reports: ND652666-ND6: Cold Water: A Novel Supercritical-Fluid Solvent
 printer friendly
Figure 1. Hypothetical phase diagram of cold water. TM is the melting line. TH is the line of homogeneous ice nucleation. The location of the liquid-liquid coexistence curve is sketched as suggested by Mishima, The suggested location of LLCP (C2) is about 30 MPa. The continuation of the liquid coexistence curve into the one-phase region is the line of maximum fluctuations, the Widom line.
If the metastable liquid-liquid transition in water exists (and if it is terminated by a critical point), the addition of a solute should generate a line of liquid–liquid critical points emanating from the critical point of pure supercooled water. We have analyzed thermodynamic consequences of this scenario. In particular, we consider the behavior of two systems, H2O-NaCl and H2O-glycerol. We have found the behavior of the heat capacity in supercooled aqueous solutions of NaCl to be consistent with the presence of the metastable liquid–liquid transition. We have elucidated the non-conserved nature of the order parameter (extent of “reaction” between two alternative structures of water) and the consequences of its coupling with conserved properties (density and concentration). It has been also shown how the shape of the critical line in a solution (the so-called “Krichevskii parameter”) controls the difference in concentration of the coexisting liquid phases.
To developed thermodynamics of aqueous solutions it was assumed that liquid water is a "mixture" of two states, A and B, of the same molecular species. For instance, these two states could represent two different arrangements of the hydrogen-bond network in water and correspond to the low-density and high-density states of water. The fraction of water molecules, involved in either structure, is controlled by thermodynamic equilibrium between these two structures. Unlike a binary fluid, the fraction is not an independent variable, but is determined as a function of pressure and temperature from the condition of thermodynamic equilibrium. The critical temperature is to be specified through the temperature dependence of the equilibrium constant.
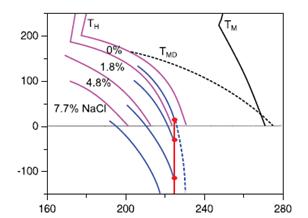
Figure 2. Suggested Pressure (MPa)-Temperature (K) phase diagram for supercooled aqueous solutions of sodium chloride exhibiting liquid–liquid transitions hidden by homogeneous ice formation. Solid pink curves show homogeneous ice formation TM labels the equilibrium melting temperatures and TDMthe maximum density temperatures.
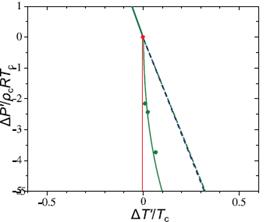
Figure 3. A comparison of the proposed equation of state with the simulation results of Corradini and Gallo for the TIP4P model The green solid line and green dashed line show a linear approximation of the LLT and Widom line for the TIP4P model. Green circles show the critical points calculated at different mole fractions of NaCl in simulation, while the red line shows the critical line for the equation of state. The critical point of H2O is shown as a red circle. The data of Corradini and Gallo re-scaled so that the LLT has the same slope as in real water.
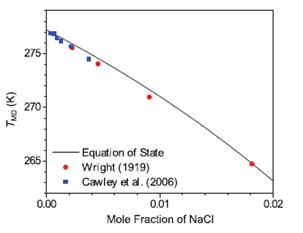
Figure 4. Temperature of maximum density in aqueous solutions of supercooled water. The black line shows the equation of state developed in this project, while the red squares and blue circles show the measurement results.
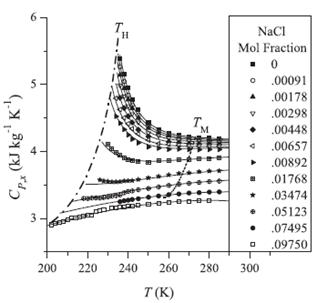
Figure 5. Suppression of the anomaly of the heat capacity in aqueous solutions of sodium chloride. Symbols: experimental data of Archer and Carter. Solid curves: predictions based on two-state thermodynamics. Dashed curve shows the positions of the melting temperatures Dashed-dotted curve shows the temperatures of homogeneous ice formation.
The results of comparison between the developed theory and available experimental and simulation data are shown in Figures 2 through 5. The agreement between the theory and experiment is remarkable. Thus we have confirmed that the existing experimental and simulation data on supercooled water are consistent with the concept of water’s polyamorphism.
We also report the results of a computer simulation study of the thermodynamic properties and the thermal conductivity of supercooled water as a function of pressure and temperature using the TIP4P-2005 water model. The thermodynamic properties are represented by the two-structure equation of state consistent with the presence of a liquid-liquid critical point in the supercooled region. The simulations confirm the presence of a minimum in the thermal conductivity, not only at atmospheric pressure, as previously found for the TIP5P water model, but also at elevated pressures. This anomalous behavior of the thermal conductivity of supercooled water appears to be related to the maximum of the isothermal compressibility or the minimum of the speed of sound. However, the magnitudes of the simulated thermal conductivities are sensitive to the water model adopted and appear to be significantly larger than the experimental thermal conductivities of real water at low temperatures.