Reports: DNI552279-DNI5: Rapid Prediction of Sulfide and Oxide Catalyst Surface Structures Using Insight from Density Functional Theory
Lars C. Grabow, PhD, University of Houston
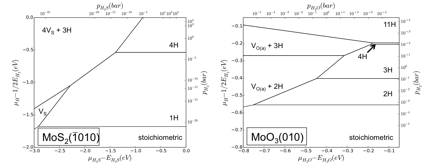
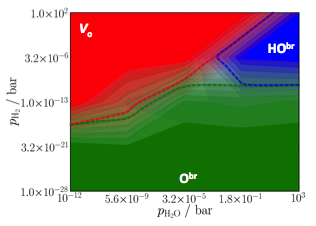
Figure 1 Surface Phase Diagram for MoS2(-1010) and MoO3(010)
under hydrotreating conditions.
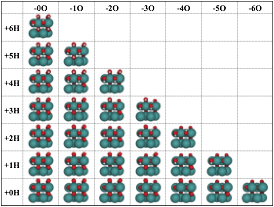
Figure 2 Grid representation of surface terminations obtained
by adding H (vertical) or creating O vacancies (horizontal) to the
stoichiometric RuO2(110) surface (bottom left).
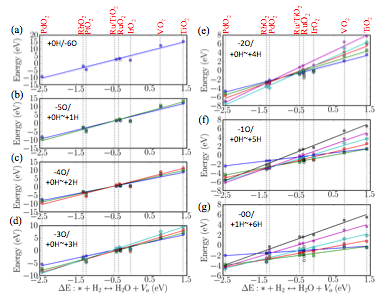
Figure 3 Linear scaling relations for rutile surface free
energies as a function of oxygen vacancy formation energy.
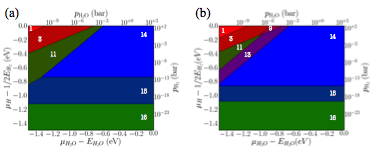
Figure 4 Comparison between the RuO2(110) phase
diagram from (a) DFT calculations, and (b) using linear scaling relations (b).
Figure 5 Kinetic phase diagram for RuO2(110)
obtained from kinetic Monte Carlo simulations.
