Reports: ND1053582-ND10: Synthesis and Characterization of a Novel and Entirely Green Hydrogenation Catalyst: Nitrogen Oligomer
 printer friendly
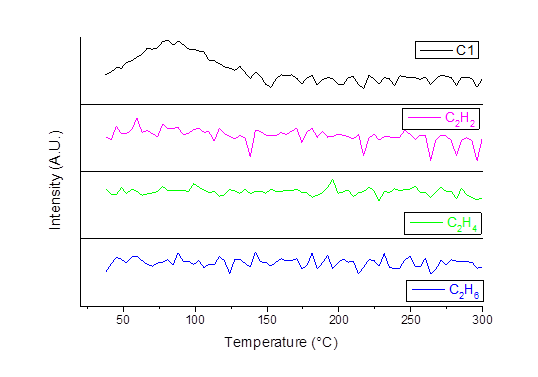
TPD was carried out to determine the thermal stability of the
samples after synthesis using a Micromeritics®
AutoChem II 2920 system. The released species during
TPD are monitored with a mass spectrometer (SRS QMS200). As shown in
Figure 1, with the increasing of azide concentration,
both the nitrogen desorption temperature for dipped MWNT sheet and PN-MWNT
sheet shifted to lower temperatures, which indicates an increasing amount of
weaker attached nitrogen compounds as the azide
concentration increases. Indeed, nitrogen compounds tend to occupy the sites
that will form stronger interactions with MWNT for a lower overall
thermodynamics free energy. For dipped MWNT sheets, initially the nitrogen
desorption amount increased with the increasing of azide
concentration, from 2M to 4M the desorption amount did
not increase much which suggests saturation of the sites within the MWNT.
However, the nitrogen desorption amount for PN-MWNT continuously increased with
the increase of azide concentration, suggesting more
nitrogen oligomers formed with higher azide
concentrations from 0.5M to 4M. The quantities of nitrogen oligomer (Table 1)
on MWNT are calculated based on the TPD results from Figure 1. This is further
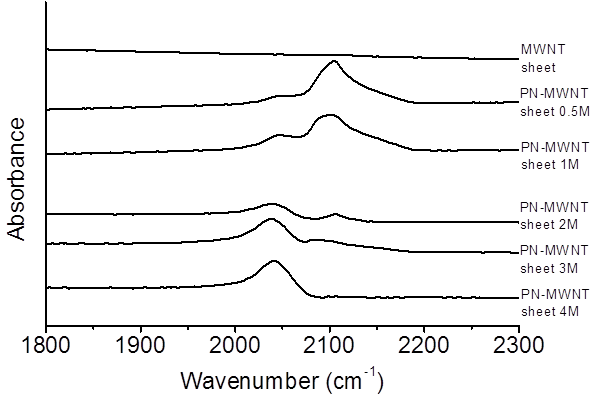
proved by FTIR results in Figure 2, which showed that the intensity of the peak
at around 2050 cm-1 continuously increased with azide
concentration.
Table 1. Corresponding nitrogen desorption amount (mmol/grams of sample) calculated by integration of the TPD
results and comparing the peak areas from Figure 1 with those from injection of
pure nitrogen under the same experiment conditions. azide concentration
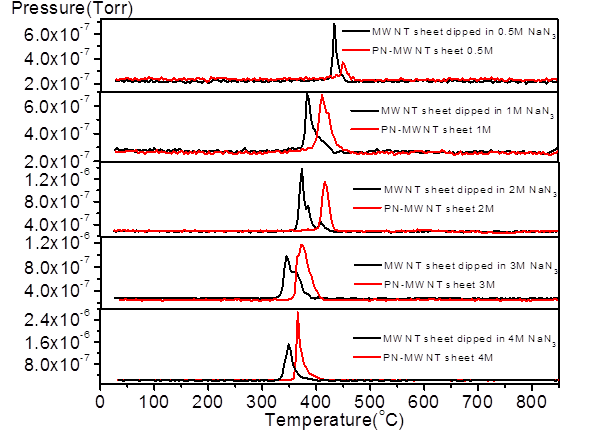
Figure 1. TPD results for dipped MWNT sheets and PN-MWNT sheets with 0.5~4M azide concentrations for electrochemical synthesis. The
results have been normalized by sample weight.