Reports: UNI653258-UNI6: Spectroscopic Study of Graphene Halogenation Dynamics in the Gas Phase and in Solution: New Two-Dimensional Materials for Catalysis
Andrew C. Crowther, Ph.D., Barnard College
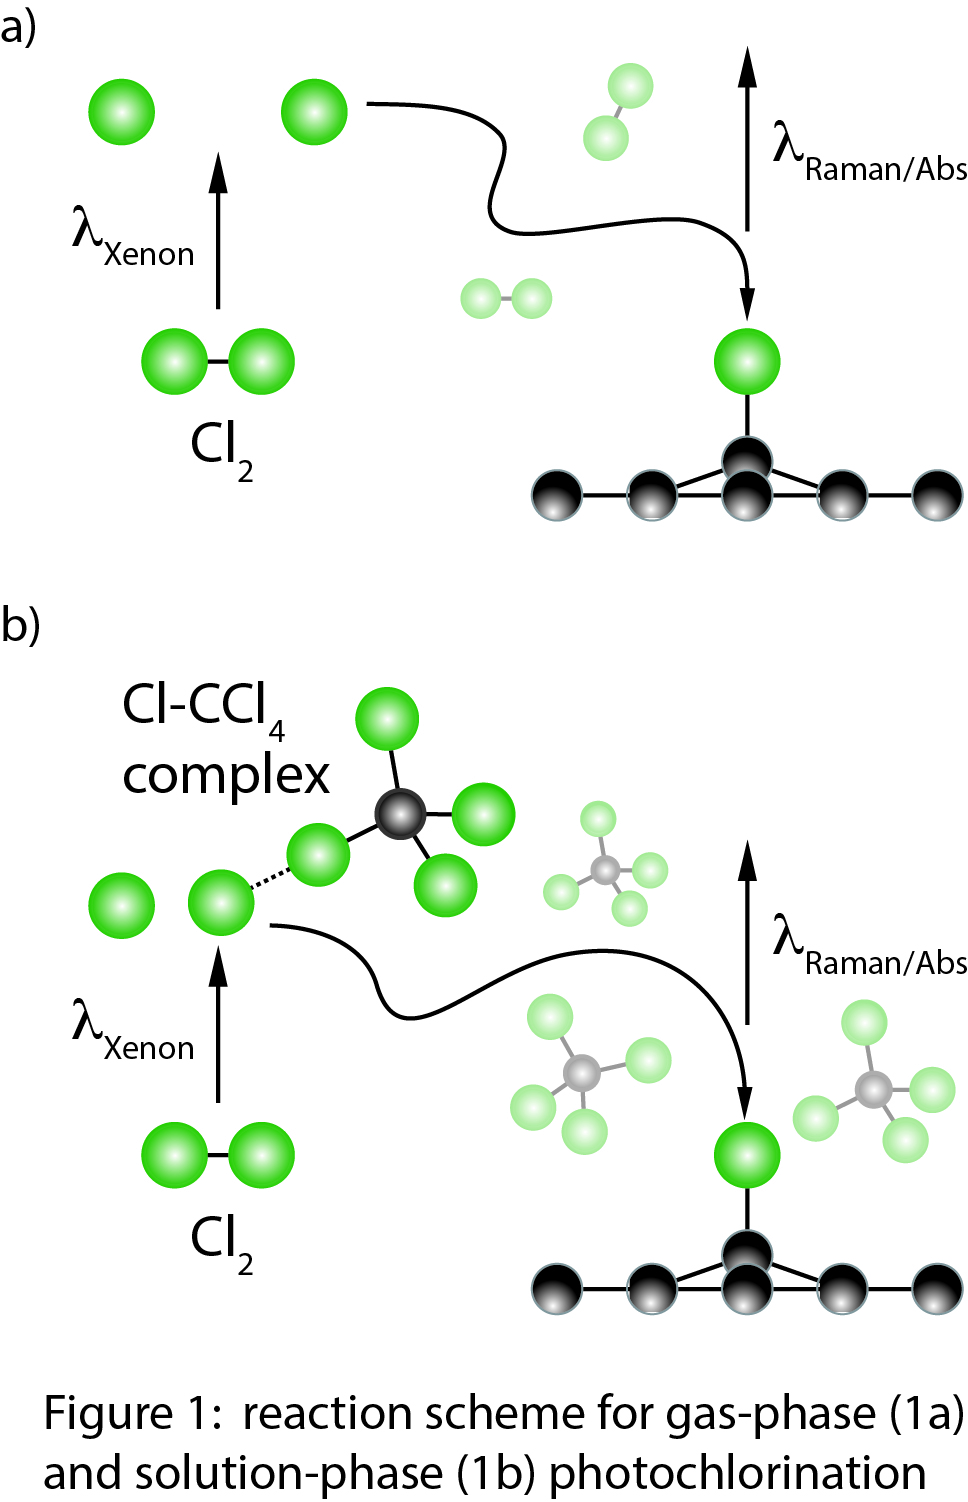
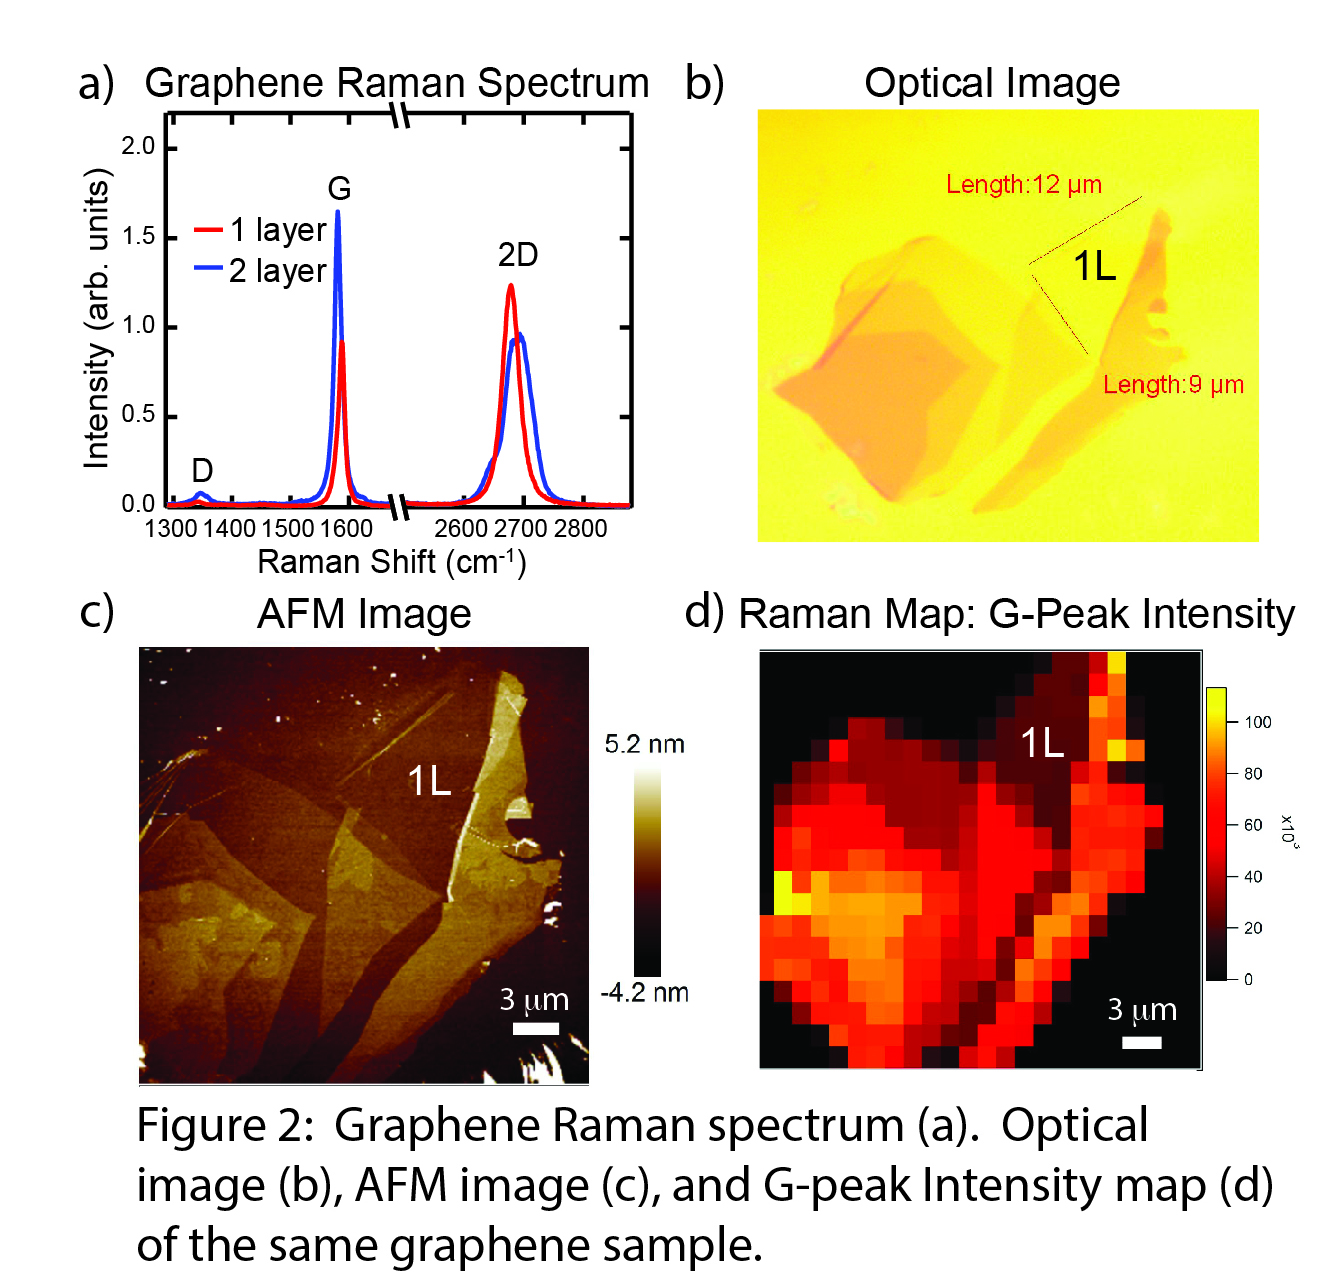
In our experiments, we generate graphene via mechanical exfoliation onto a silicon substrate with a 290 nm SiO2 layer. The sample is exposed to Cl2 gas, and a Xenon lamp photodissociates the Cl2 to form reactive Cl radicals. We use micro-Raman spectroscopy, micro-absorption spectroscopy, and atomic force microscopy to measure the extent of reaction as a function of irradiation time (Figure 1a). We also perform these measurements in a variety of solvents to assess the role of solvent polarity and different Cl2-solvent complexes on photochlorination dynamics and make a direct comparison to the gas phase (Figure 1b). Raman spectroscopy is our principal characterization technique (Figure 2a). The G-peak (1580 cm-1) intensity scales with the number of graphene layers and shifts to higher energy upon electron-transfer between graphene and adsorbed species. The 2D-peak (2700 cm-1) shape is sensitive to the number of graphene layers. The D-peak (1350 cm-1) is absent for pristine graphene, and increases in intensity with greater sp3 hybridization of graphene carbon atoms. In particular, the ID/IG ratio is a sensitive probe of the C-Cl bond density in chlorographene products.
During the past year, we have installed an XY microstage on our microscope with submicron spatial resolution, so we can now measure Raman spatial maps of our samples to evaluate the homogeneity of the reaction progress, including how reactivity differs between graphene's edges and interior regions. We have also begun performing atomic force microscope measurements at a Columbia University user facility. These measurements show that the D-peak intensity increases as a result of functionalization, not sample deterioration. Finally, we have implemented micro-absorption spectroscopy on our micro-Raman spectrometer using a white light source, allowing us to measure electronic spectra of our samples to complement the vibrational spectra from Raman measurements. Our mapping capability extends to these micro-absorption measurements. These characterization capabilities are summarized in Figure 2, where an optical image, AFM image, and a G-peak intensity Raman map are shown for the same graphene sample.
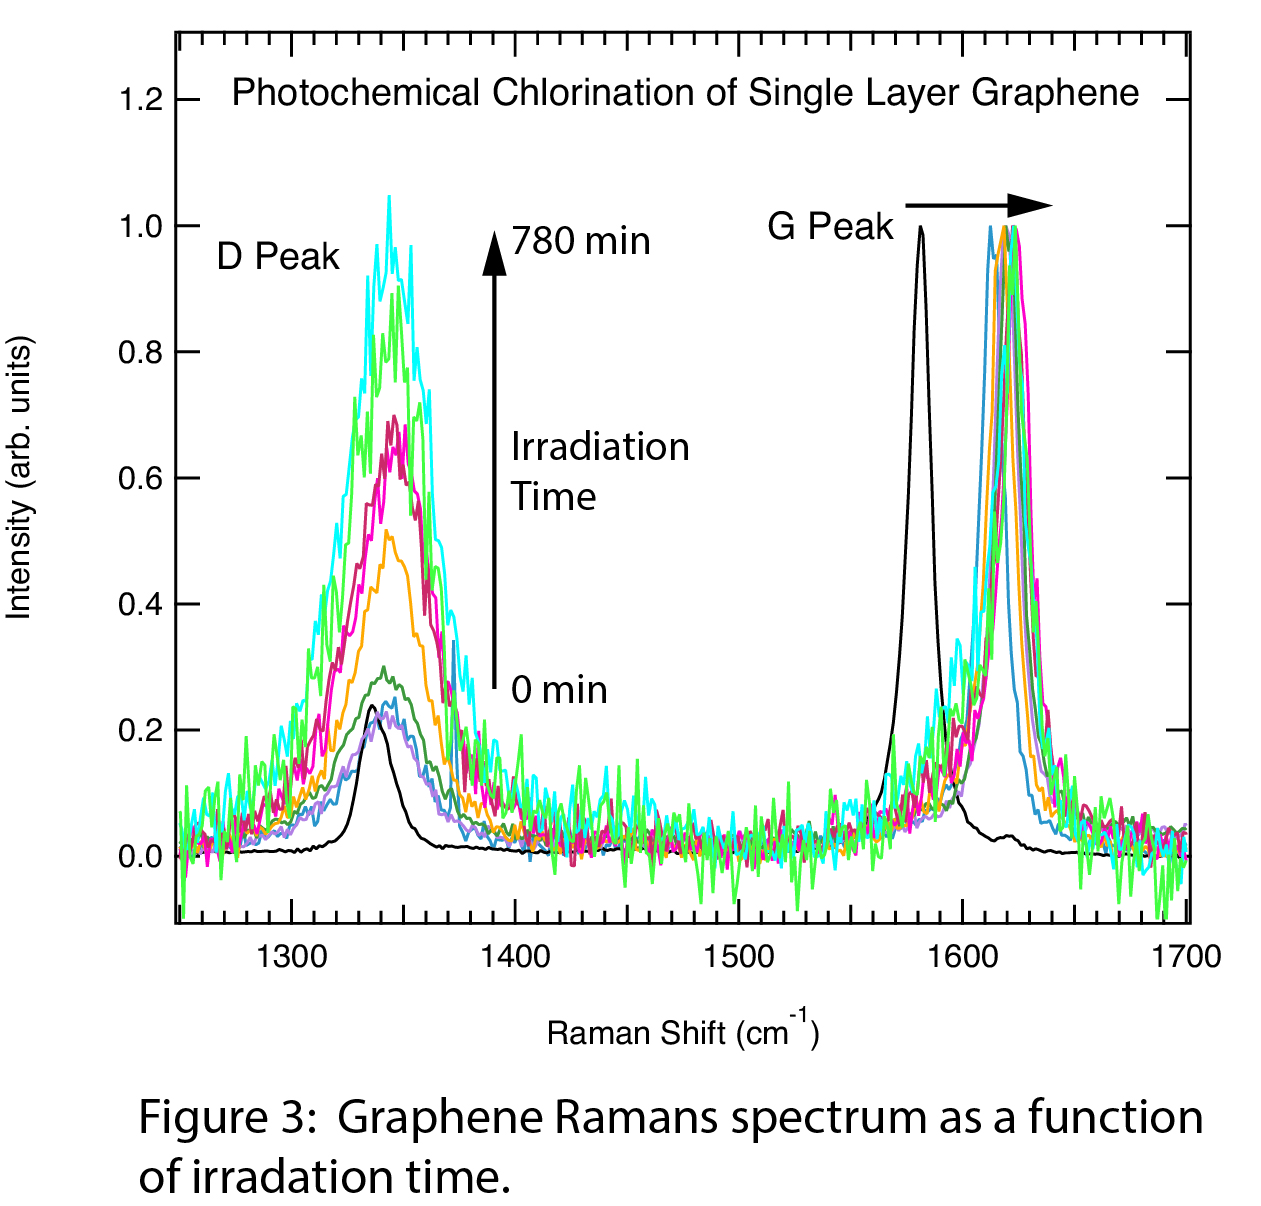
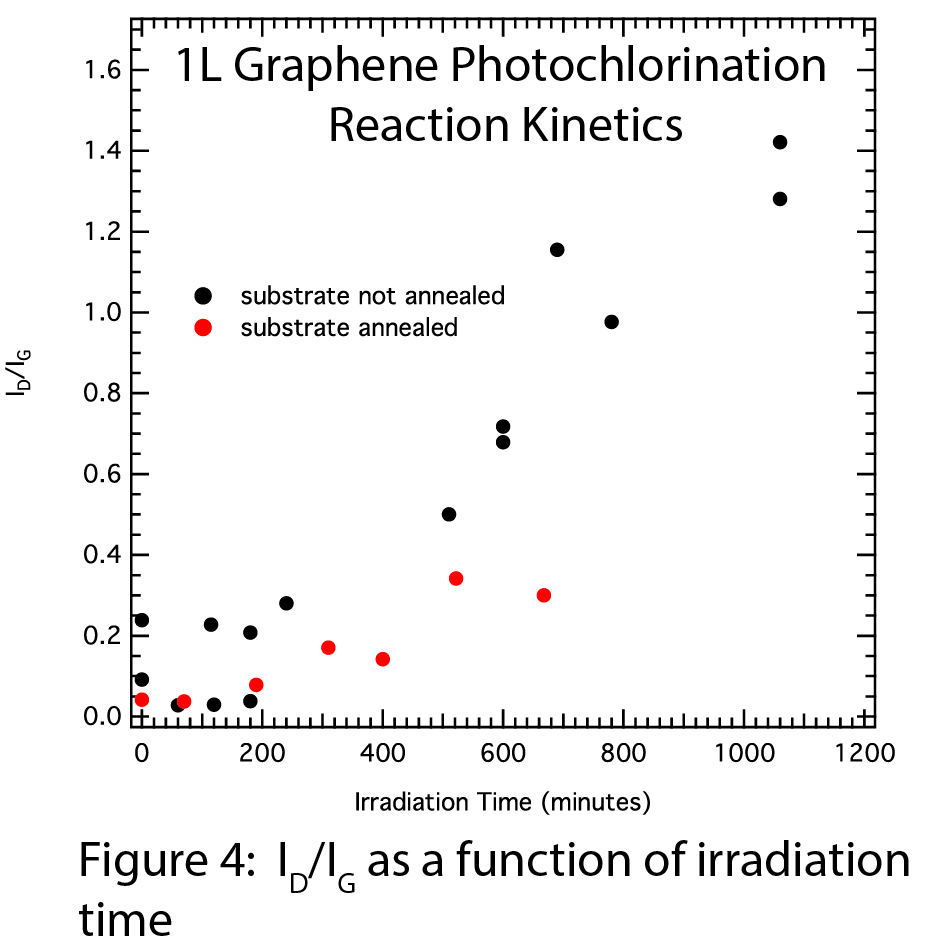
We have successfully made initial, reproducible measurements of the gas-phase chlorination kinetics. Figure 3 shows the D and G Raman peaks during the photochlorination reaction, normalized to the G-peak. As the irradiation time increases, the D-peak intensity increases relative to the G-peak, indicating the formation of chlorographene. The G-peak position also shifts to higher energy with irradiation time, which reflects both graphene charge-transfer doping by Cl2, and formation of the chlorographene product. The ID/IG ratio is plotted as a function of irradiation time in Figure 4, and shows a reaction that occurs on a timescale of hours. Samples that we anneal at 400 degrees Celsius do not react substantially faster, so annealing induced strain does not appear to enhance reactivity. AFM measurements taken before and after photochlorination indicate that we are forming chlorographene and not etching away our graphene sample.
Photochlorination measurements in solution show the importance of using nonreactive solvents. We generate chlorographene in water, but not in dichloromethane, since hydrogen abstraction by chlorine radicals is endothermic in water and exothermic in dichloromethane. Subsequent annealing of the reaction product after evaporation of the water results in a reduction of the D-peak intensity, indicating again that our D-peak intensity increase is not due to Cl etching graphene. Photochlorination in solution also occurs over several hours, although a direct comparison with the gas-phase results will require additional data.
This grant has supported the efforts of three undergraduate research students on this project to date. Judy Gong (BC '14) installed the optics, wrote computer code, and performed preliminary measurements for the micro-absorption measurements. Katherine Rinaldi (BC '15) has performed nearly all gas-phase chlorination experiments, which included installing a vacuum line for exposing samples to Cl2 gas and performing Raman spectroscopy and AFM measurements. Nilam Patel (BC '16) has completed a similar set of experiments in solution. This grant also provided travel support for Katherine to present a poster on her work at the American Chemical Society 2014 Spring National Meeting in Dallas. I anticipate that Katherine and Nilam will both attend the ACS Spring Meeting in Denver this upcoming year to present posters on their recent work.
The Petroleum Research Fund has been instrumental in advancing our studies of graphene photochlorination in a variety of chemical environments. Undergraduate research students working in my group have successfully generated chlorographene in the gas phase and in solution, and significantly expanded our characterization abilities. My group is currently reproducing earlier measurements and expanding our efforts to examine the affects of sample annealing, the number of graphene layers, and solvent mixtures on graphene reactivity.

