Reports: DNI952340-DNI9: Coupled Fluid and Solid Mechanics Study for Improved Permeability Estimation of Damaged Formations Near Wellbore
 printer friendly
Formation damage refers to the reduction of near wellbore permeability due to an alteration in the flow path structure within the rock. Most often this is due to the invasion of particles in the drilling fluid or injection water, migration of fines from pore to pore, and increased water saturation, all of which reduce relative permeability to hydrocarbons.
Formation damage is usually quantified using "skin factor", which requires knowledge of the depth of penetration of fines and the amount of permeability reduction in the damaged zone. Skin factor is extracted from well test data analysis, and depth of penetration and permeability reduction are calculated based on the extracted skin factor. Thus, well testing techniques inform us about the extents of the formation damage only after the well has been completed and the well has produced for a while. It would be useful to know the possible extents of the formation damage before the onset ofany drilling or injection job in order to optimize the operations. A popular method for predicting the formation damage is Deep Bed Filtration (DBF) model:
![]()
where C is the concentration of solids in suspension, ? is the porosity of the porous filter, U is the velocity of the flow, Tp is the rate of solid entrapment, and s is the entrapped solid volume fraction. Tp is a phenomenological parameter, typically determined from experiments. Although there are semi-analytical correlations that express Tp in terms of fluid properties and flow conditions, those correlations are mostly derived from filtration theory principles that assume sub-micron particulates. Size of suspended particles in drilling mud or produced water can span sub-micron to 100 microns, and that is a challenge for modeling predictions.
Main drawback of the rate of solid entrapment experimental determination is that it is not possible to test every single scenario of fluid property and flow condition. Solid retention in porous media is a strong function of most of flow and fluid properties. For such a multi-parameter problem it is very important to understand the relative importance of different parameters in order to optimize the solution. Relative significance of different factors in filtration translates to the relative efficiency of different capture mechanisms. In this study we chose a microscopic numerical simulation approach to investigate different capture mechanisms of particles in porous media.
2 Summary of the results
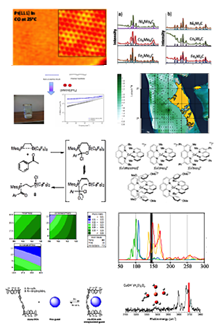
We coupled computational fluid dynamics and discrete element method (CFD-DEM) to directly simulate the flow of suspensions in porous media. Pore space of the porous filter is extracted from the micro-CT images of realistic porous samples; in this case a disordered monodisperse sphere pack and Fontainebleau sandstone. Fig. 1 shows a snapshot of the particulate flow simulation depicting particle capture in a disordered sphere pack.
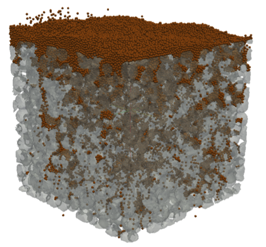
Figure 1: suspension of small particles (brown) flowing through a disordered sphere pack (gray). Particle to grain size ratio is 1:10.
We extracted the number of entrapped particles by investigating the velocities of particles. Fig. 2 shows the velocity distribution of particles at different time steps. It can be seen that as filtration proceeds in time, the fraction of particles moving slower than a specific velocity increases; hence we decided to choose this velocity as the cut off for distinguishing entrapped from flowing particles.
Fig. 3 and 4 show the entrapped solid volume fraction vs. time for the sphere pack and Fontainebleau samples. For each sample total volumetric flow rate of suspended solid particles are kept constant while flow velocity and solid concentration changed. Particle entrapment in the sphere pack shows a strong dependence on flow properties. The rate of solid entrapment in the disordered sphere pack increases as the flow velocity decreases. On the other hand, the rate of particle entrapment does not show remarkable change for different flow rates through Fontainebleau sample.
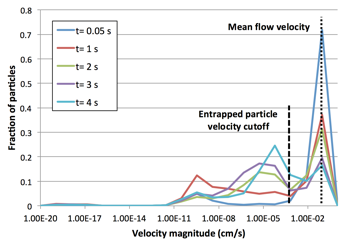
Figure 2: Velocity distribution of particles at different times. At the beginning of the flow most of the particles travel in the pore space with the same velocity as the mean flow velocity. As the flow proceeds and filtration takes place, less particles move with velocities close to the mean flow velocity. This is an indication of particle entrapment. In addition, this chart shows that the particle entrapment does not take place instantaneously: they slow down while continuing to roll on the surface of the grains.
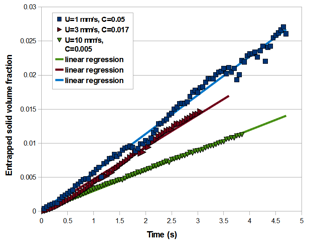
Figure 3: Entrapped particles volume fraction change in time for different flow properties through the sphere pack sample. The linear trend of the curves indicates that the rate of entrapment corresponds to the early stages of filtration when the rate of entrapment is constant.
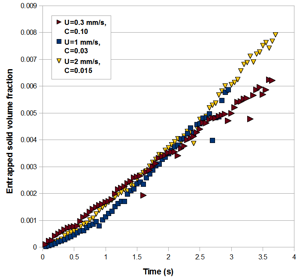
Figure 4: Entrapped particles volume fraction change in time for different flow properties through Fontainebleau sample.
We applied the correlation of the bi-disperse sphere pack permeability to estimate the permeability reduction in the invaded sphere pack sample. The ratio of damaged to clean sample permeability is plotted vs. entrapped solid volume fraction in Fig. 5. Permeability reduction shows a consistent trend for different flow conditions. This suggests that although the rate of entrapment is different under different flow rates, the final retention profile results in the same overall permeability of the damaged sample.
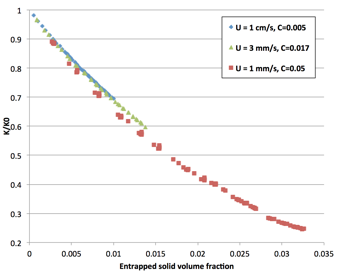
Figure 5: Damaged to intact sphere pack permeability ratio vs. entrapped solid volume fraction under different flow conditions.
3 Impact
The graduate student Maryam Mirabolghasemi enjoyed research and tuition support for one semester from ACS-PRF in 2013/14, and she was a teaching assistant at other times. Maryam presented a poster at AGU Fall meeting in December 2013, and PI Prodanovic gave a talk at Computational Methods in Water Resources conference in June 2014. We have a journal publication in review with Journal of Hydrology. We thank Texas Advanced Computing Center for computational resources.