Reports: DNI1053270-DNI10: Rapid-Thermal Catalytic Conversion of Petroleum Products into Multilayer Graphene
 printer friendly
The support from ACS Petroleum Research Fund has provided direct support to 2 graduate students during the past year, and also significantly enhanced the Principal Investigator’s research expertise in the area of carbon nano-materials synthesis and manufacturing.
Year 1 Progress
In accordance with the Project Timeline, Year 1 was focused on Task 1 (Exploration of Metal Alloy Catalysts for Multilayer Graphene Conversion of Uniform Thickness) and Task 2 (Development of Rapid-thermal Conversion). All progresses are on, or ahead, of the overall project schedule.
Task 1 Exploration of Metal Alloy Catalysts for Multilayer Graphene Conversion of Uniform Thickness Progress Overview
We demonstrate the controlled synthesis of graphene and graphite by utilizing differences in carbon solubility of heterogeneous catalyst metals during rapid-thermal chemical vapor deposition (CVD) synthesis. We developed a transfer loadlock in our conventional CVD system to allow rapid-thermal processes and utilized patterned catalysts of Co on Cu thinfilms to enable controlled synthesis of multilayer graphene with minimal dewetting.
By patterning different catalyst metals on designated areas, graphene with varying thickness can be grown on localized areas. Thick multilayer graphene (i.e., graphite) is grown by segregation and precipitation of the dissolved carbon on the surface of catalyst metals, such as Ni or Co. Thin or single layer graphene is synthesized by adsorption of carbon on the catalyst Cu surface, which only has negligible carbon solubility (<0.0001 at.% at 1000 oC). Even with the same catalyst metal, we can control the thickness of graphite by modulating the thickness of the catalyst metal during synthesis.
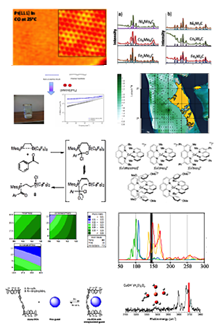
Figure 1 shows the optical image of graphite letters and graphene background synthesized on different catalyst metals. Vowels (i.e. E’s) were patterned with thicker Co (750 nm) on Cu background (700 nm), while consonants (i.e. M, C, H and S) were patterned with thinner Co (200 nm). The color contrast between vowels and consonants shows the difference in thickness of the synthesized multilayer graphene. Atomic force microscopy scans showed thicknesses of ~23 nm for vowels, ~4 nm for consonants and <1 nm for the background graphene.

Figure 1. Synthetic control of graphene layers. Optical microscope images of graphene with different numbers of layers. Consonant letters (M, C, H and S) are composed of thinner graphite (~4 nm) and vowel letters (E) are composed of thicker graphite (~23 nm). Background is compsed of bi- to tri-layer garphene on a 285 nm thick SiO2/Si substrate.
We also performed Raman characterizations to demonstrate thickness control (Figure 2). Raman spectra from the three different graphite or graphene regions exhibited distinct characteristic bands of graphene and graphite: (1) D band centered at ~1,350cm-1, (2) G band centered at 1,590cm-1, and (3) 2D band centered at ~2,690cm-1. The background graphene shows a smaller G band intensity compared to the 2D band intensity (2D/G~1.6), indicating bi- or tri-layer graphene. The graphite on vowel regions shows a much lower 2D band intensity compared to that on consonant regions. This low 2D to G ratio, non-symmetric tendencies, and a slight blue-shift due to interlayer binding prove that the graphite on vowel regions represents much thicker graphite than that on consonant regions.
Figure 2. Raman spectra of graphite and graphene with different thickness: red (thicker graphite; vowels), black (thinner graphite; consonants), and blue (bilayer graphene; background).
Task 2 Development of Rapid-thermal Conversion Progress Overview
We also focused on developing a rapid-thermal conversion setup. This setup allows rapid heating and cooling rates for the conversion process as well as minimizes the catalyst dewetting process which often occurs in conventional graphene CVD process.
Figure 3 shows the developed rapid-thermal conversion setup. We utilized micro-combustion for local heating with controlled heating/cooling rates. For this study, oxygen (O2) is used as an oxidizer and H2 is used as fuel. To avoid any undesired surface oxidization, the amount of O2 is controlled to be less than the stoichiometric amount. In addition, the gasket prevents the Cu foil surface coated with PMMA (poly(methyl methacrylate)) from being contaminated by products of combustion in the exhaust gas flow. After ignition, the flame is stabilized at the center of the gas channel and provides heat to Cu foil during the synthesis. The desired graphene synthesis site is marked as the shaded oval area which is on the opposite side of the flame as shown in Figure 3c.
Figure 3. (a and b) A schematic diagram and picture of the developed rapid thermal conversion setup. (c) Flame (heating area) occurs at the mix zone of oxidizer and fuel. The shaded oval is the desired site for graphene synthesis.
With this newly developed rapid-thermal graphene synthesis setup, we have carried out graphene synthesis using a thin PMMA as a solid-state source. Raman characterization (Figure 4) was carried out to analyze the quality of graphene synthesized by this method. Raman spectrum shows 2D band (~2,690 cm-1) and G band (~1,590 cm-1) with their relative intensity ratio at around ~2, suggesting the presence of graphene. In addition, a small D band (~1,350 cm-1) is observed which indicates existence of defects in the synthesized graphene.
Figure 4. Raman spectrum of graphene synthesized by the rapid-thermal conversion setup.
In Year 2, we plan to further optimize the quality and uniformity of graphene and multilayer graphene synthesized by this approach (Task 2) as well as expand to various petroleum products as source materials of this rapid-thermal synthesis (Task 3).