Reports: DNI852293-DNI8: The Use of Low-Field Nuclear Magnetic Resonance Measurements to Monitor Microbial Growth
 printer friendly
In the second year of the project we focused on collecting T2-relaxation measurements, and 2D NMR relaxation measurements. We focus on the direct contribution of microbes to the NMR signals in the absence of biomineralization. Shewanella oneidensis (MR-1), a facultative metal reducer known to play an important role in subsurface environments, was used as a model organism and was inoculated under aerobic condition. Data were collected using a CPMG pulse sequence, which was to determine the T2-distribution, and using a pulse gradient spin-echo (PGSE) plus a CPMG pulse sequence, which was used to encode diffusion properties and determine the effective diffusion–spin-spin relaxation correlation (D-T2) plot. Data were collected on live and dead (lysed) cell pellets, on cell suspensions with different dilutions, and on cells growing within porous media. A summary of the microbial conditions and materials used is provided in Figure 1.
The data show no obvious change in the T2-distribution with S. oneidensis density in suspension (Figure 2a); however, a small change can be seen in the sands inoculated with S. oneidensis at different densities (Figure 2b). Although not apparent in the T2-relaxation time distributions, the effect of S. oneidensis density in suspension is more apparent in the D-T2 plots (Figure 3). A clear distinction in the T2-distribution and D-T2 plots can be seen between the live and dead cell pellets (Figure 4 and Figure 5). Finally, a small but consistent change was seen in the T2-relaxation time distribution as microbes were grown in porous media (Figure 6). These results will provide a basis for understanding the effect of microbes within geologic media on low-field NMR measurements. This research is necessary to determine if NMR measurements can ultimately to be used to monitor microbial growth and activity in oil reservoirs.
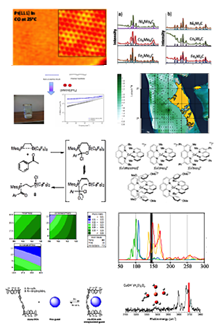
Figure 1. Measurement conditions and materials: (a) Shewanella oneidensis growth inocula, (b) harvested cell pellets, (c) two types of silica sands: IOTA quartz (left) and Ottawa sand (right), and (d) in-situ growth of S. oneidensis is silica sands.
Figure 2. T2 relaxation time distributions for S. oneidensis cell suspensions at different dilutions (concentrations): 1X (in blue), 0.5X (in green), and 0.0625X (in red) (top); different dilutions of cell suspension mixed with silica sands samples (bottom).
Figure 3. D-T2 maps for S. oneidensis cell suspension at different dilutions: original undiluted suspension (top), dilution 1 = 0.5X (middle), and dilution 2 = 0.0625X (bottom).
Figure 4. T2 relaxation time distribution for S. oneidensis cell pellets in both live (red) and lysis (blue) conditions for different biomass: (a) 2.14 gram, (b) 2.40 gram, and (c) 2.87 gram. The distribution shows a clear distinction between the live cell pellets and the dead cell pellets. The appearance of a second shorter T2 in lysed pellets is also observed.
Figure 5. D-T2 maps for S. oneidensis pellets in both live (left column) and lysed (right column) condition for two different biomasses: 2.87 gram (top row) and 4.95 gram (bottom row). The dash line indicates the self-diffusion coefficient D of water at 30 ¼C (2.59 x 10⁻⁹ m2/s).
Figure 6. The T2-relaxation time distribution on the silica sand columns inoculated with S. oneidensis over the growth period (only 40 hours shown here) at echo time = 200 µs.