Reports: DNI752537-DNI7: Effects of Confinement on Phase Behavior, Structure, and Dynamics of Attractive Colloidal Suspensions
 printer friendly
(1) Protocols for imaging colloid-polymer mixtures
We wrote a protocol for imaging confined suspensions in quiescent conditions and during flow using confocal microscopy; because this technique allows a thin section of an optically transparent sample to be imaged with high spatiotemporal resolution, it is particularly suited to probe structure and dynamics of particles at the single-particle scale. We first prepared mixtures of micron-sized poly(methyl methacrylate) particles and non-adsorbing depletant polystyrene polymers that were density- and refractive-index matched. Next, we reported a standard protocol for imaging quiescent mixtures under varying confinement in thin wedge-shaped cells (Figure 1). Finally, we demonstrated a protocol for imaging mixtures during microchannel flow. These protocols will help students and researchers who plan to image concentrated suspensions using confocal microscopy.
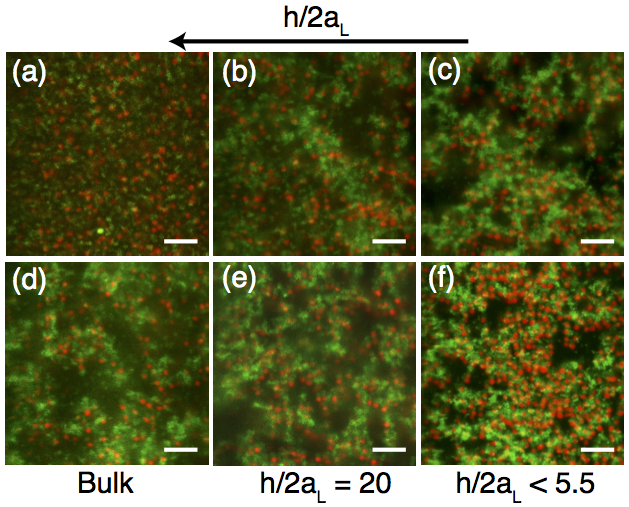
Figure 1: Confocal micrographs of bidispersed mixtures of small (green) and large (red) particles in suspensions with a constant total volume fraction φtot = 0.15, volume percent of small particles r = 0.50, depletant concentration cp (a-c) 5 mg/ml or (d-f) 25 mg/ml, (a,d) in bulk or (b-c, e-f) confined to a normalized height h/2aL of (b,e) 20, or (c,f) < 5.5. The large and small particle diameters are 2aL = 1.48 μm and 2aS = 0.73 μm, respectively. The scale bar is 10 μm.
(2) Transport of nanoparticles in nanopost arrays
Nanoparticles transported through highly confined porous media exhibit faster breakthrough than small molecule tracers, which impacts their efficacy as interfacial agents in enhanced oil recovery (EOR). The microscale mechanisms leading to early breakthrough, however, have not been identified. We flowed 400 nm polystyrene nanoparticles through square arrays of nanoposts (edge-to-edge post spacings of 0.8–2 μm) and measured their dispersion in the post arrays at the single-particle scale. For highly confined flows of dilute suspensions, Figure 2 shows that the longitudinal and transverse velocities exhibited distinct scaling behaviors. Moreover, the distributions of transverse particle velocities became narrower and more non-Gaussian when the particles were strongly confined. As a result, Figure 3 shows that the transverse dispersion of highly confined nanoparticles at low Péclet numbers was significantly less important than longitudinal dispersion, leading to early breakthrough. This finding suggests a fundamental mechanism by which to control dispersion and thereby improve efficacy of nanoparticles in EOR.
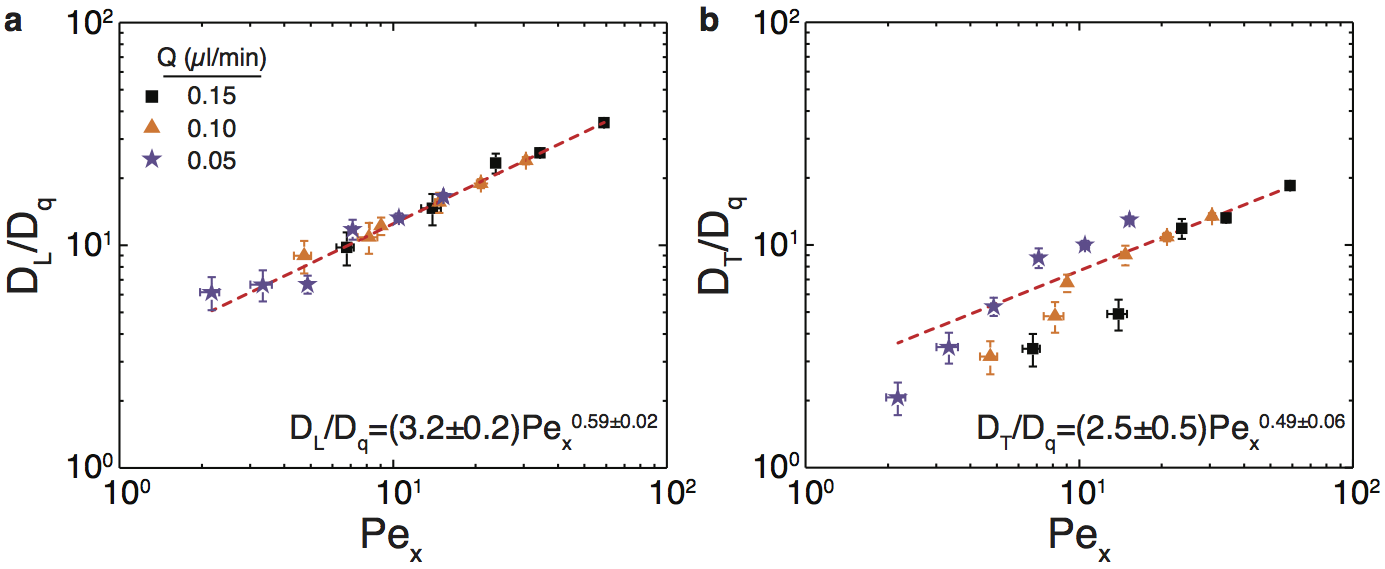
Figure 2: (a) Ratio of longitudinal diffusivity to quiescent diffusivity DL/Dq as a function of longitudinal Péclet number Pex for 400 nm particles transported through post arrays. Red line indicates fit to a power-law model. (b) Ratio of transverse diffusivity to quiescent diffusivity DT/Dq as a function of Pex for 400 nm particles. Red line indicates fit to a power-law model. Horizontal and vertical error bars respectively indicate uncertainty in the measured post spacing and in the fitting of the velocity distributions.
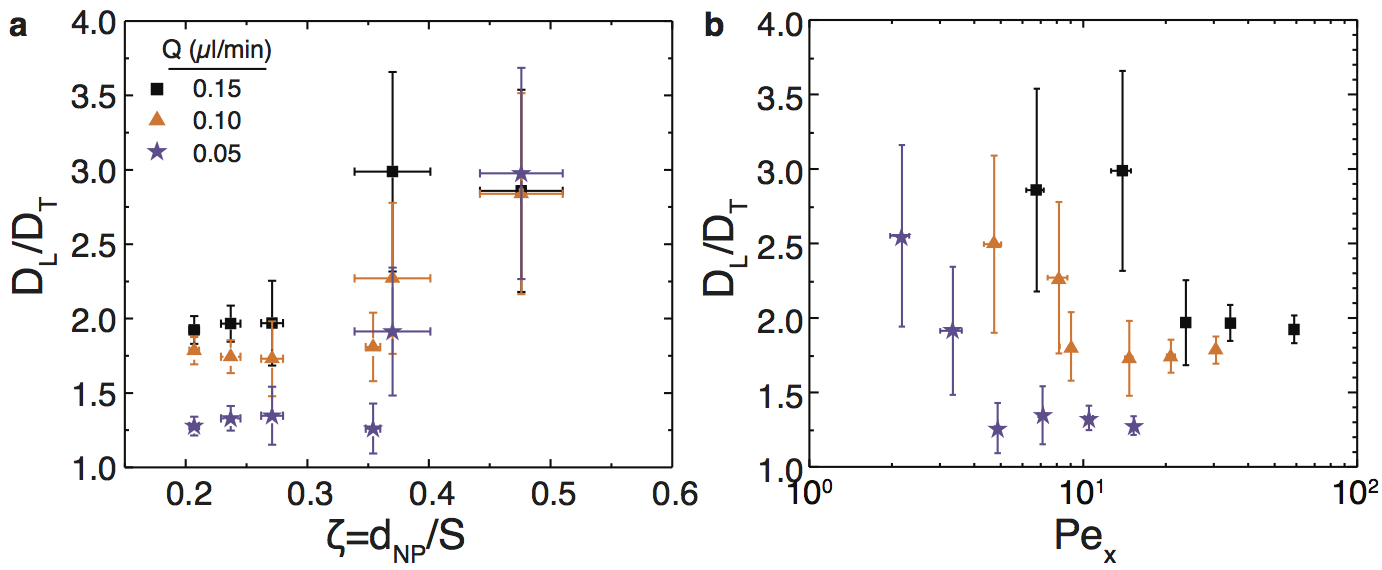
Figure 3: (a) Ratio of longitudinal and transverse diffusivities DL/DT as a function of confinement parameter ζ = dNP/S for 400 nm particles transported through post arrays. (b) DL/DT as a function of Pex for 400 nm particles transported through post arrays. Symbols indicate bulk flow rates of Q = 0.05 (purple stars), 0.10 (orange triangles), and 0.15 (black squares) μL/min. DL/DT is nearly constant at small ζ (large Pex) and increases significantly at higher values of ζ (small Pex).
(3) Diffusive dynamics of nanoparticles in semidilute polyelectrolyte solutions
To complement studies of confined transport in hard porous media (nanopost arrays), we measured the mobility of dilute dispersions of nanoparticles of diameter 400 nm diffusing in semidilute solutions of polyelectrolyte polymers as a model soft porous medium. We imaged and tracked hydrophilic polystyrene nanoparticles of diameter 400 nm moving in aqueous solutions of partially hydrolyzed polyacrylamide (HPAM) of molecular weight 8,000,000 Da and concentration of 0.042–4.2 g/L. Figure 4 shows that the effective diffusivity of the nanoparticles in the semidilute polymer solutions, extracted from the long-time limit of the mean-squared displacement using the Stokes-Einstein relation, was greater than that calculated from the zero-shear-rate bulk viscosity. For concentrations c ≥ 0.42 g/L, Figure 5 shows that the particle dynamics were subdiffusive at short time scales and Fickian on long time scales. The time scale for the crossover from subdiffusive to Fickian dynamics increased with increasing polymer concentration; moreover, it was longer than the relaxation time scale for polymer blobs and shorter than that for the chain. Our results suggest that the nanoparticle dynamics are coupled to those of the polymers on a length scale intermediate between the blob size and the end-to-end distance of the polymer. Because HPAM is used as a viscosifier and gellant in EOR, we expect that coupling between particle and polymer dynamics will affect the dispersion of nanoparticles in EOR applications.
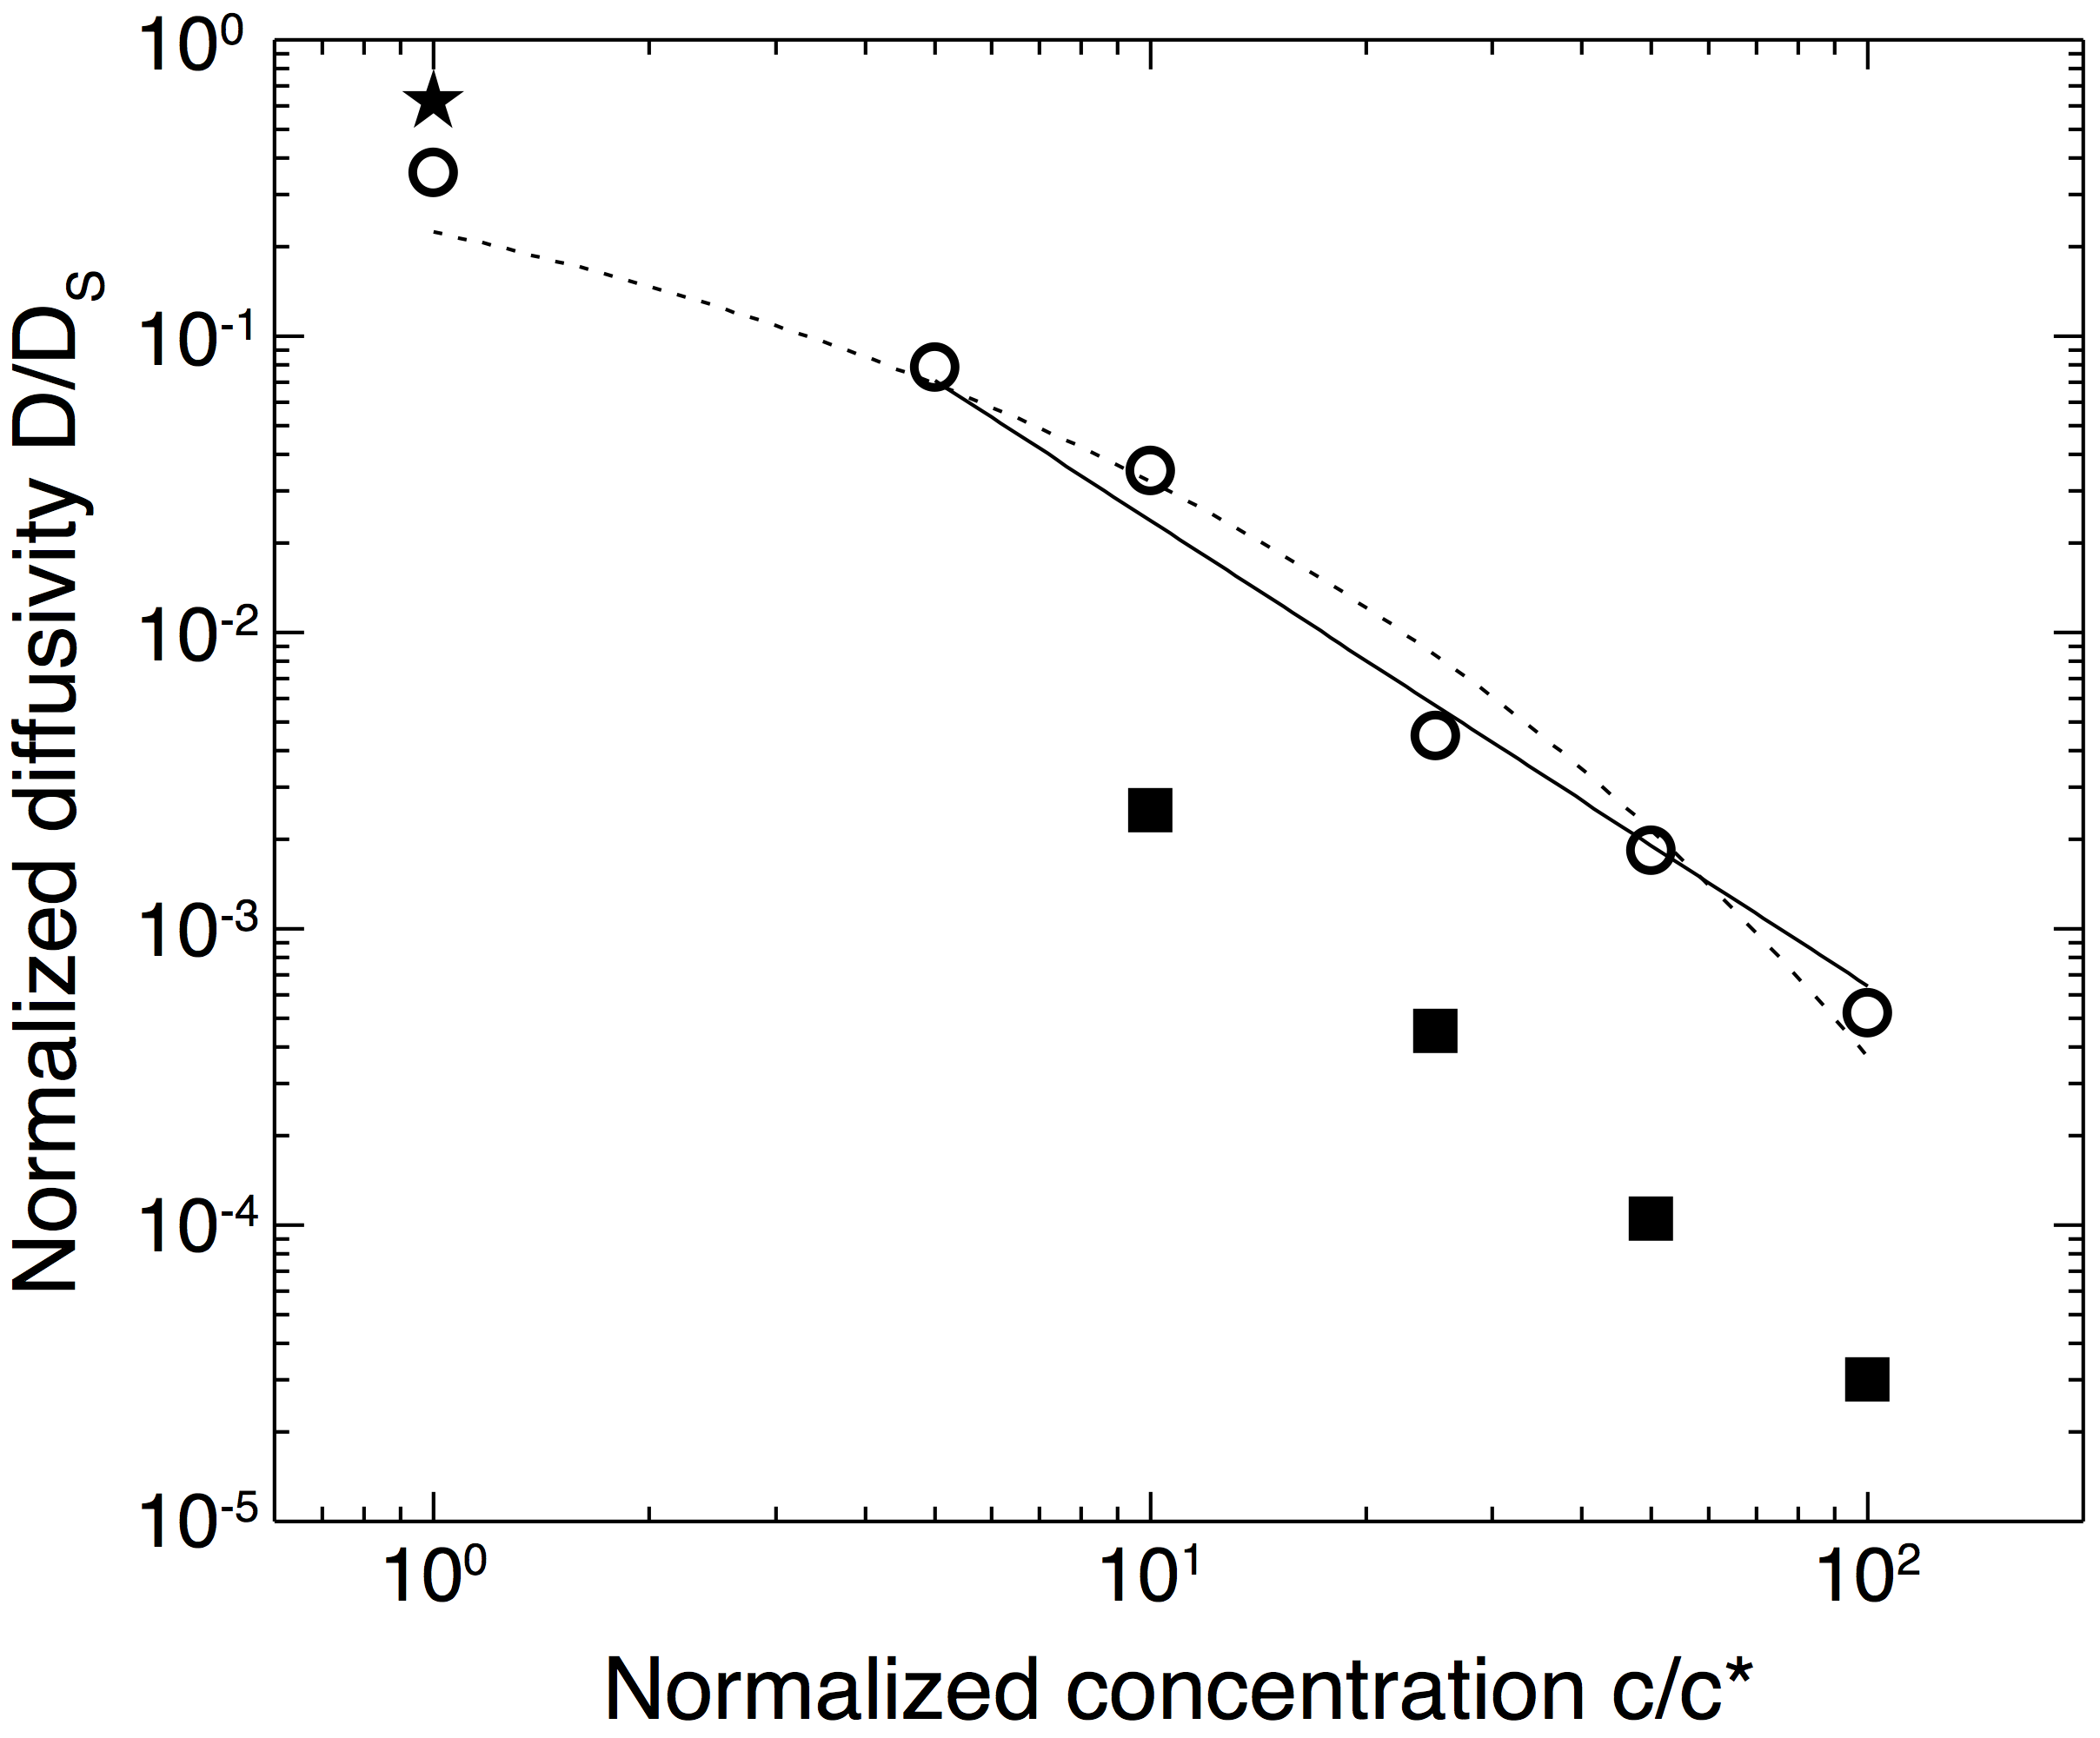
Figure 4: Nanoparticle diffusivity Deff/Ds
extracted from mean-squared displacements as a function
of the normalized polymer concentration c/c* (open symbols). Solid
symbols indicate the diffusivity calculated from experimental
measurements of the bulk viscosity: squares use the zero-shear
viscosity measured for solutions with c/c* ≥ 6.7 (corresponding
to c ≥ 0.42 g/L), and the star (c/c* = 0.67, corresponding to c
= 0.042 g/L) uses the viscosity measured at a shear rate of 233
s-1 using a capillary viscometer. The dashed and solid
lines show fits to models by Phillies
(Macromolecules 1986, for all data) and Cai,
Panyukov, and Rubinstein
(Macromolecules 2011, for c/c* ≥ 1
only).
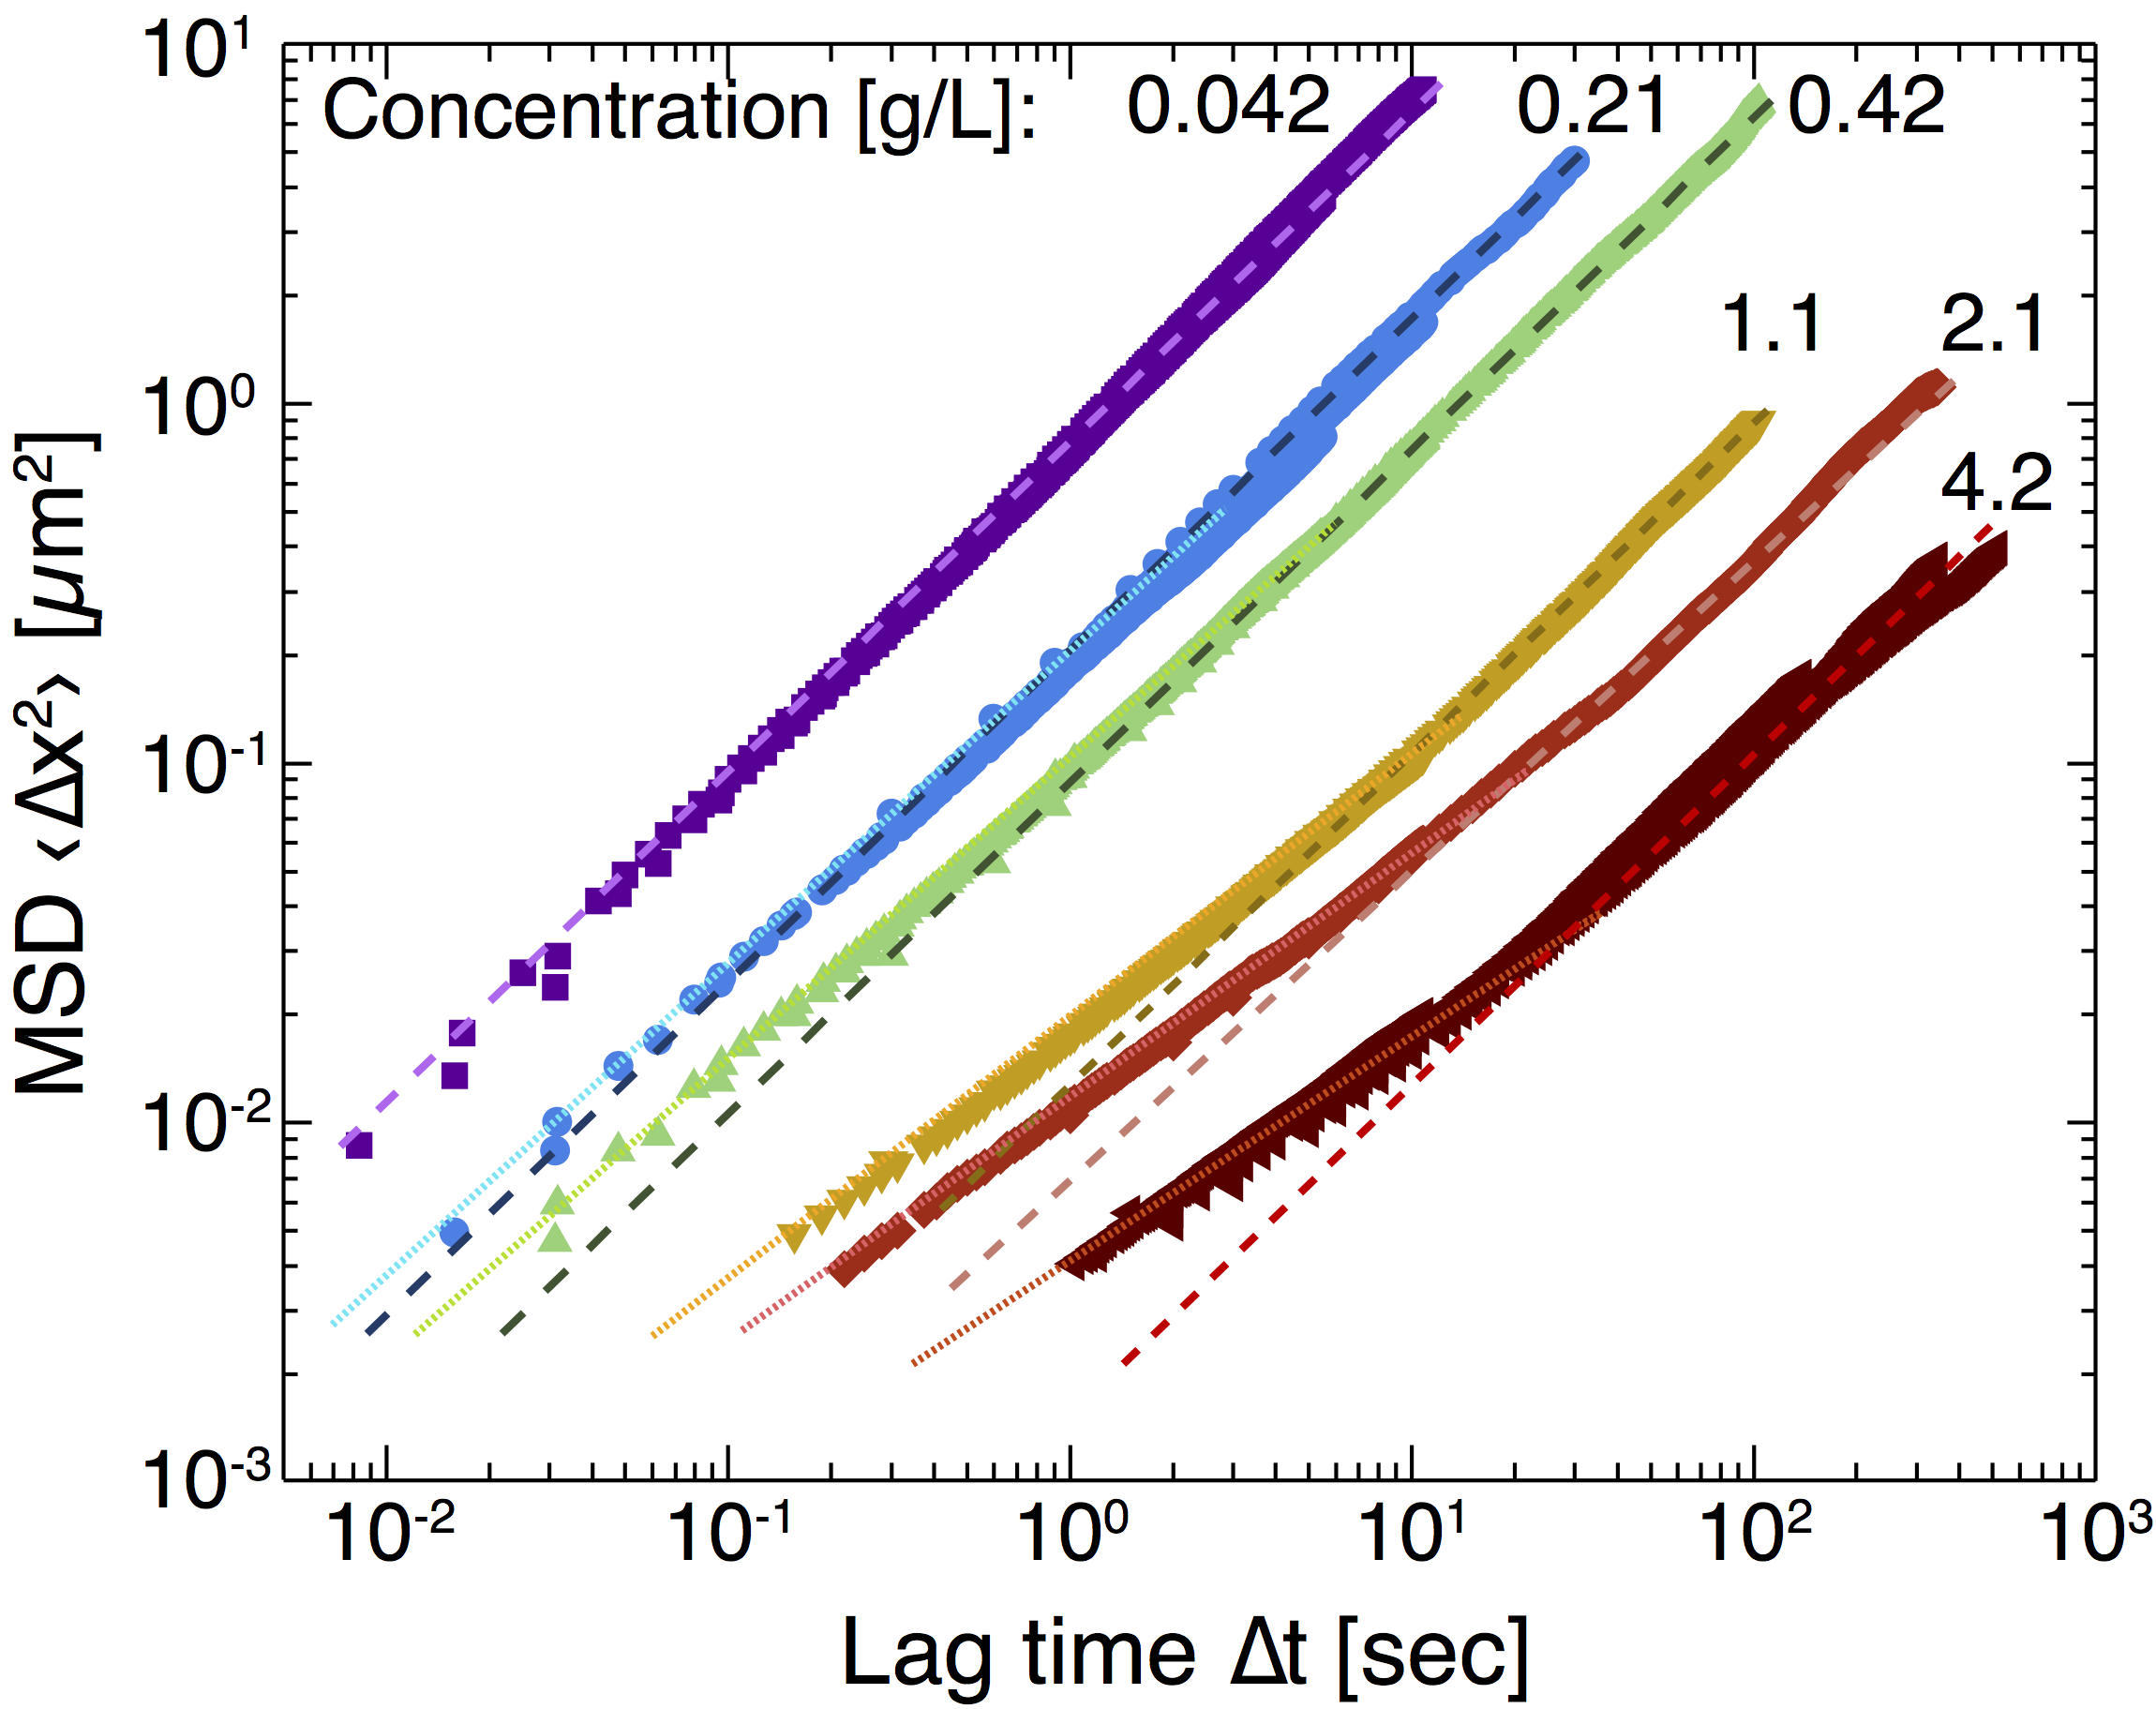
Figure 5: Mean-squared displacement (MSD) as a function of lag time for 400 nm diameter nanoparticles in aqueous solutions of solutions of hydrolyzed polyacrylamide of varying concentration c (in units of g/L). Dashed lines indicate linear fits at long time scales; dotted lines indicate power-law fits with varying exponent at short time scales.