Reports: UNI653486-UNI6: Mechanism of Multi-Spectral Infrared Imaging on Water-Oil Mixture
Debing Zeng, PhD, Saint Peter's University
In the past academic
year, three undergraduate students with physics major/minor worked on this
project. Their initial goal was to gain hands on experiences in the lab by
characterizing the oil samples with an optical spectrometer and a thermal
infrared (IR) camera that was available immediately in our lab. It was my hope
that this preliminary study could inspire them to do scientific research in
their further study and career. The team designed the experimental setup for data
acquisition, and wrote the necessary codes with a programming language called
“Python” to facilitate this study. Below is a summary for their efforts:
1)
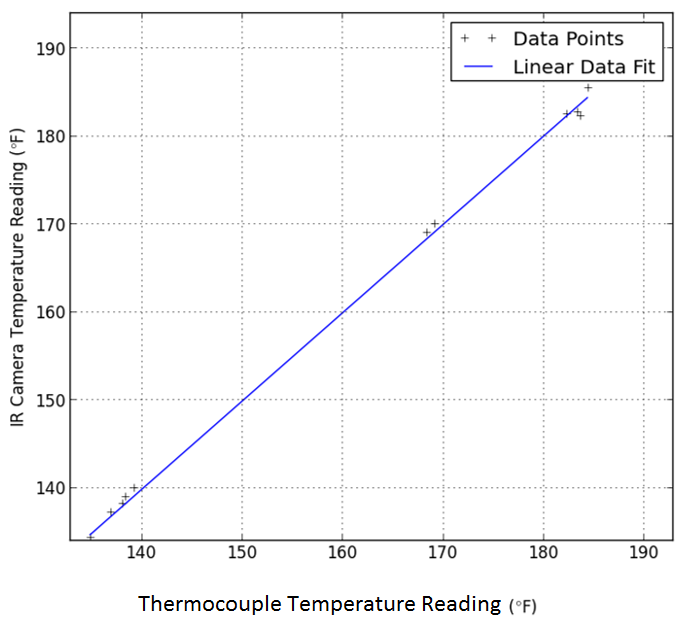
Calibration of the IR camera: In order to have accurate
temperature measurements through the thermal IR camera, appropriate calibration
for the camera is very important. As mentioned in the camera’s user manual, the
error percentage of its temperature reading is +/- 2 oC. However when
it was tested against thermocouple with tolerance of +/- 0.2 oC, a
nice correlation within +/- 1 oC was acquired. During the
experiment, a piece of paper was printed out in black by a regular printer and it
was then placed on a piece of aluminum plate as the target for the camera. The
tip of the thermocouple was attached tightly to the surface of this target. During
the temperature data acquisition with the camera, its parameters were changed while
the distance of the target away from the camera was fixed at 20 cm with the emissivity
of this target set at 1. The data about atmospheric conditions in the lab were
entered manually into the camera. The atmospheric data did not seem to create
much of a difference in the temperature reading (Fig. 1). However the distance
and emissivity had more noticeable effects on the camera’s temperature reading.
Fig 1.Temperature
calibration of InfraredCamerawith
ThermocoupleThe second attempt to calibrate the IR camera was to use an aluminum plate
painted with black ink from a regular ball point pen. This method produced somewhat
better results over the above-mentioned calibration method because it provided
better thermal contact than the paper did with the plate.
Also studied was the relationship between emissivity and temperature
measurement by the IR camera. A fourth degree polynomial fit was fit nicely into
the data and in the upper range of emissivity above 0.85, where emissivities of
most materials lie, there was essentially a linear relationship between the
emissivities and measurements by the camera, as shown in Fig. 2.
Fig 2.Temperature response withchange
inemissivity
2)
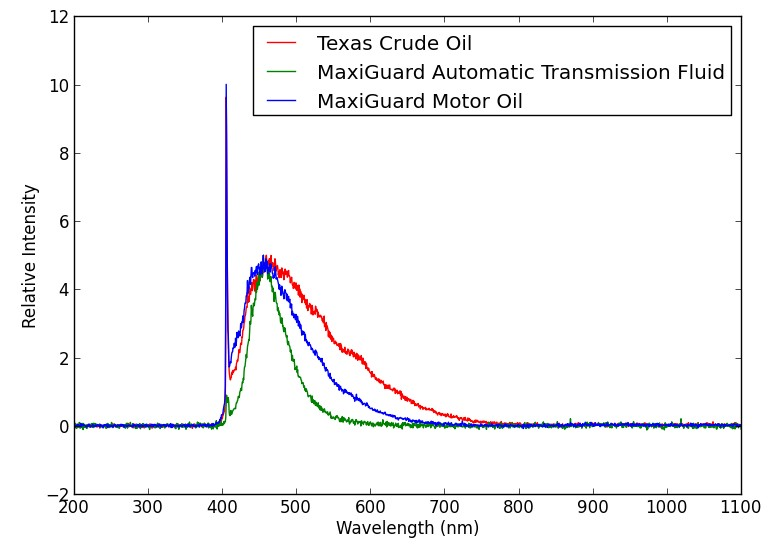
Fluorescence of the samples: Threesamples ofoil, whichareMaxiguardAutomaticTransmissionFluid,MaxiguardMotorOilandTexasCrudeOil,
were studied with fluorescence.While these samples arephysicallydistinguishablethroughtheir colors,theyalsoproduced threedistinguishablefluorescencespectra
(Fig. 3).
Fig. 3 fluorescence spectra from oil samples3)
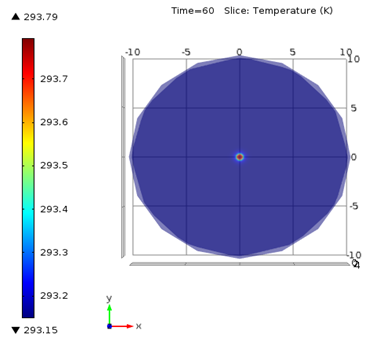
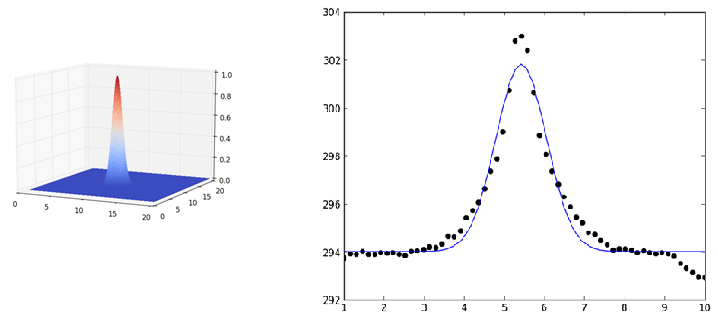
Simulation through COMSOL
Multiphysics: With a laser pointer
with 5mW in power heating on the surface of the oil samples, the temperature
response depends upon the thermal capacity and thickness of the oil samples as
well as the environmental temperature. A commercially available software called
COMSOL Multiphysics was used to simulate this effect. However, the simulation result
by COMSOL shows a rise in temperature of about 1K (Fig. 4) due to the laser
heating, which is not consistent with the rise of temperature as much as 10K
(Fig 5.) from the actual measurements. Further experiments and more accurate
simulation are needed to analyze the inconsistency.
Fig 4. Simulation of the temperature increase by
1K in laser induced heating
Fig. 5 Rise in temperature by 10K with a laser of
5mW in power
 printer friendly