Reports: ND852963-ND8: Calcification in Calcite Seas
 printer friendly
Background
The CaCO3
minerals aragonite and calcite form as common abiotic precipitates in seawater
and represent the most abundant composition of the shells and skeletons of
marine invertebrates. Oscillations in the main composition of abiotic CaCO3
precipitation through deep time suggests that the past 540 million years can be
subdivided into three intervals of ‘aragonite seas’ and two intervals of
‘calcite seas’ during which seawater conditions favored the abiotic precipitation
of either aragonite or calcite. This aragonite/calcite sea hypothesis
represents the main environmental context in which to assess the evolution of
CaCO3 biomineralization. Interpretation of the fossil record in the
context of the established aragonite/calcite sea hypothesis, however, has produced
contradicting results.
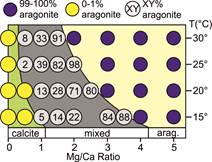
Methods CaCO3
precipitation experiments were carried out at Mg:Ca ratios between 0.5 and 5.2,
at temperatures of 15°, 20°, 25°, or 30°C, and at a fixed salinity of 35. CaCO3
precipitation was initiated in two different ways: (1) by CO2
degassing or (2) by constant addition of NaHCO3. The constant
addition experiments were further subdivided into solutions that remained still
and solutions that were shaken on an orbital shaker at 80 rpm. For the
degassing set-up, solutions were briefly bubbled with CO2 before
adding Na2CO3 immediately before the start of the
experiment. For constant addition NaHCO3 was added at a rate of 0.25 mM/h over 6 hours. For both
experimental approaches nucleation
occurred within 1-9 hours. Subsamples of the solution and of glass slides
within the solution were collected every hour. The mineralogy of precipitates
was determined using Raman spectroscopy and the distribution and morphology of
crystals was documented using scanning electron microscopy. Of subsamples
containing the first precipitates 5-10 images of the same magnification were
taken containing a total of at least 100 crystals. These images were manually
transformed into separate black & white images for calcite and aragonite
crystals and the area coverage was calculated using imageJ. Preliminary
results
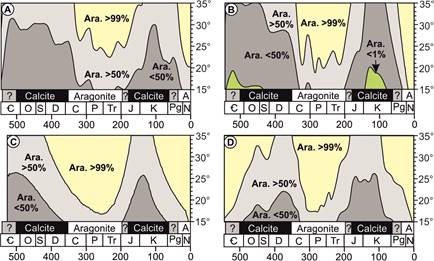
Figure 2.
Models of Phanerozoic Mg:Ca ratio expressed as percent of abiotic aragonite at
a given temperature. Vertical axis as temperature (°C) and horizontal axis in millions of years. Black and white boxes
labelled ‘aragonite’, ‘calcite’, and ‘?’ indicate the stratigraphic duration of
traditional aragonite and calcite sea intervals. The models used are: A: Berner
(2004, American Journal of Science); B: Demicco et al. (2005, Geology); C:
Arvidson et al. (2013, Chemical Geology); D: Farkaš et al. (2007, Geochimica et
Cosmochimica Acta).