Reports: ND951836-ND9: Multiscale Modelling of the Interface of Model Crude Oils with Water
 printer friendly
Simulation Details
We have performed detailed Molecular Dynamics simulations with the Gromacs 4.5 package and the CHARMM27 force—field under NpT conditions. The molecules are arranged in slab geometry, i.e. we have a flat oil water interface. The current model systems contain heptane as prototype alkane and toluene as aromatic.
Tab 1. Simulations of fresh and salt water
| Molecular type | Number of molecules | |||
|---|---|---|---|---|
| Fresh 1 | Salt 1 | Fresh 2 | Salt 2 | |
| HEP | 500 | 500 | 444 | 444 |
| TOL | 694 | 694 | 750 | 750 |
| SPE | 8449 | 8269 | 7241 | 7087 |
| Na+ | - | 90 | - | 77 |
| Cl- | - | 90 | - | 77 |
| System | Interfacial Tensions (mN/m) | ||
|---|---|---|---|
| Calculated | MD (Lit.) | Expt’l (Lit.) | |
| Pure Heptane | 51.90 | 51.96 | 51.9, 50.2 |
| Pure Toluene | 36.97 | 37.69 | 36.0, 36.4, 36.1 |
| Fresh: conc. 1 | 42.68 +/- 0.39 | 42.27 | 40 |
| Salt: conc. 1 | 42.86 +/- 0.22 | ||
| Fresh: conc. 2 | 41.87 +/- 0.21 | ||
| Salt: conc. 2 | 42.84 +/- 0.55 | ||
We find that the surface tension is only weekly affected by adding salt.
 /p>
/p>
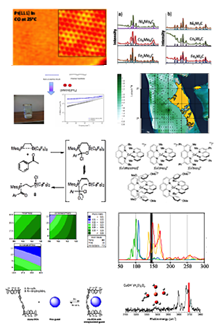
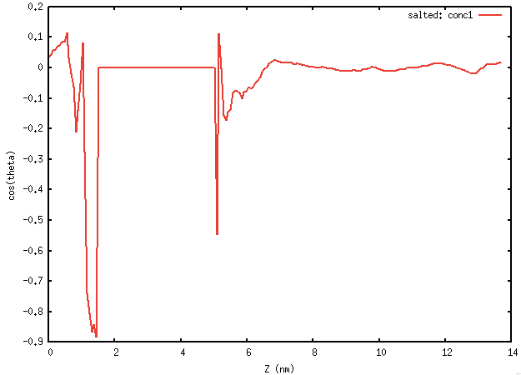
Fig 1: Left Orientation of Toluene at the interface, Right Orientation of water at the interface.
In Fig 1 we see that toluene at the interface likes to lie flat for both geometrical reasons and to optimize the weak electrostatic interactions with water. This is in agreement with our earlier results that toluene enriches at the interface. Water also orients itself at the interface such that its dipole moment right at the interface is normal to the interface again optimizing the electrostatic interactions with the enriched toluene.
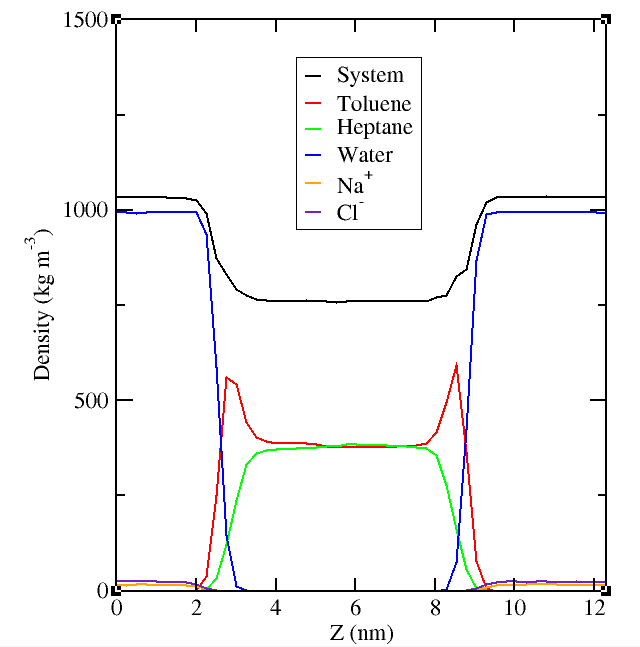
Fig 2: Density profile in salt water/oil systems
Additionally we find (Fig 2) that salt is excluded from the interface as the hydrogen bonding structure of the water is severely disrupted making it hard for water to provide an appropriate shell of hydration close to the oil.
We also performed a number of coarse-grained simulations
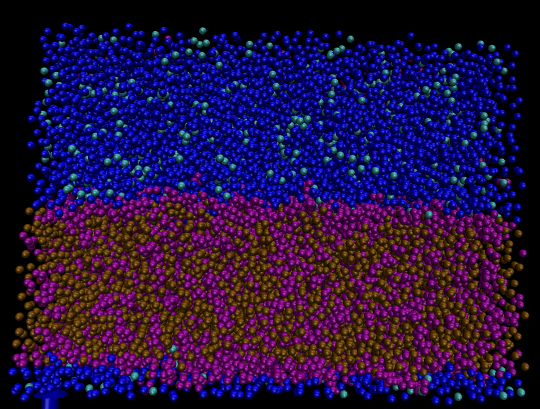
Figure 3: A coarse-grained simulation of oil and water interface.
In fig 3 The blue and cyan particles represent water and antifreeze beads. The purple and brown particles represent benzene and octane molecules, respectively. The oil phase is represented by a mixture of molecules containing 50 mol percent benzene and 50 mol percent octane. Each coarse-grained blue particle represents 4 water molecules respectively. The linear shape of Octane is roughly modeled with two coarse-grains bonded together, whereas the planar shape of benzene is represented by three coarse-grains in a triangle shape. Clearly, in the above picture we observe the aggregation of aromatic rings at the oil-water surface. The size of the simulation box is 20 nm x 20 nm x 13 nm with temperature of 300K and pressure of 1 bar maintained using the Berendsen thermostat and barostat. The above conformation is observed after 50 ns in simulation time. Approximately ten percent of the blue water beads are replaced antifreeze particles in order to prevent the water phase from becoming frozen.
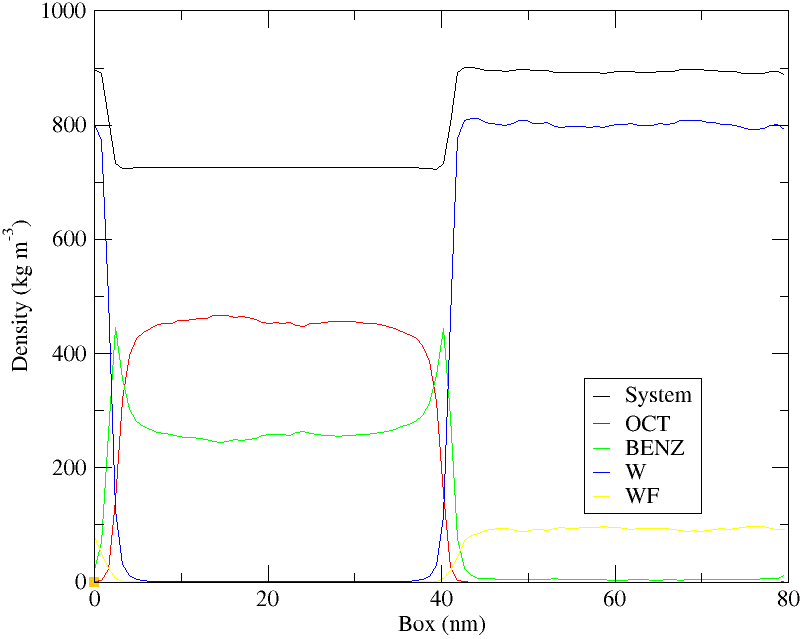
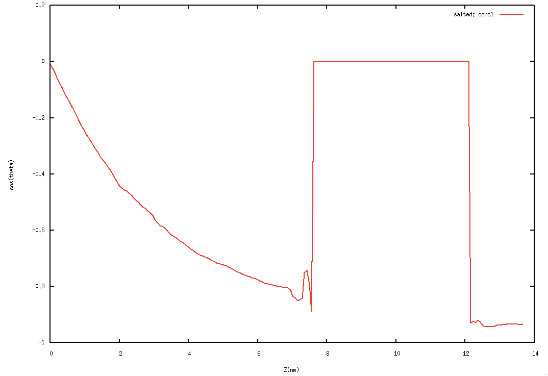
Figure 4: Lateral density profile of coarse-grained oil-water interface.
Also in the CG simulations (fig 4) we see the enrichment of aromatics at the interface. “OCT” and “BENZ” represent the octane and benzene profiles respectively, whereas the “W” and “WF” data are for the water and antifreeze coarse-grained beads. The accumulation of benzene at the two oil-water interfaces can be clearly seen. The total density of the aqueous phase is greater than that of the organic model oil mixture.