Reports: ND550829-ND5: Single Molecule Spectroscopy for Characterization of Mesoporous Acid Catalysts
 printer friendly
Significant progress has been made in developing single molecule (SM) spectroscopy for characterization of microenvironmental acidity in solid catalysts.
Catalyst Synthesis.
Sol-gel methods were used to prepare aluminosilica composite thin films suitable for use in SM spectroscopy. The procedure combined Al alkoxide precursors1 and a chelating agent2 with a tetramethoxysilane based silica sol. CTAB was used as the structure-directing agent. Thin films were obtained by spin coating followed by calcination.
pH studies of C-SNARF-1 in aqueous solutions.
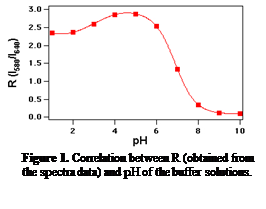
C-SNARF-1 was selected as our probe molecule. C-SNARF-1 is a dual emission dye3 that gives two emission bands at 580nm and 640nm in its fluorescence spectrum whose ratio, R (R = I580 / I640), changes with varying pH. The pH response of C-SNARF-1 was studied in aqueous solutions, using a conventional fluorimeter. R is plotted as a function of pH in Figure 1. From pH 5 to 9, R decreases with increasing pH, in agreement with the literature3. However, at pH < 5, R decreases with a decreasing pH. This was an important observation since this pH range is the most useful for studying acidic catalytic networks.
Quantification of pH in solid films.
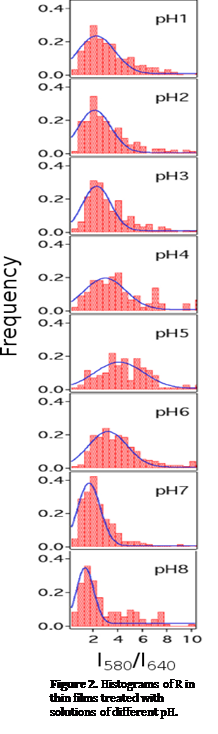
Experiments were conducted to understand the pH-dependence of C-SNARF-1 fluorescence in silica films. Pure silica films doped with C-SNARF-1 were treated overnight with solutions of varying pH (1 to 8). The films were then imaged by wide field fluorescence microscopy. Each fluorescent image was split into two spectral bands at 580nm and 640nm that were recorded by a CCD camera. Individual, well-separated dye molecules appeared as well-defined spots in the two images, from which the intensity ratio, R, of each fluorescent molecule was obtained.
All of the histograms obtained (Figure 2) were found to be positively skewed, indicating that the most common pH value differs from the mean pH in the heterogeneous network. From pH 1 to 4, the peak position shifted to larger R values with an increase of pH, while from pH 5 to 9, an opposite trend was observed. This observation was in qualitative agreement with the solution phase studies, indicating that C-SNARF-1 maintains its pH sensitivity even in a solid matrix.
Histogram width also provides insight into the silica framework and the behavior of C-SNARF-1. The solution phase studies revealed that C-SNARF-1 was most sensitive at pH between 4 and 7. Increased sensitivity in this region is expected to lead to wider histograms. However, at pH 7, we observed a relatively narrow peak. This unexpected narrowing of the distribution was attributed to buffering of the nanoscale pH by surface ÐSiOH groups, the majority of which have pKas near 7.54. In this region, the pH distribution was the most homogeneous. The peak also narrowed near pH 4, again because of buffering. A small population of ÐiOH sites are expected to have pKas around 45. The SMS studies of silica films exposed to solutions of different pH suggest that two competing factors influence the correlation between intensity ratio and pH: the sensitivity of C-SNARF-1 and the buffering effect of ÐSiOH groups.
Acidity characterization of aluminosilica composite films by SM spectroscopy.
We prepared aluminosilica composite films with 0% to 20% (molar ratio) Al dopant and added C-SNARF-1. The imaging method and data analysis procedure were the same as in the film studies described above. Histograms of the intensity ratio were obtained for each film and were fitted to double Gaussian functions (Figure 3). A more complicated fitting procedure was employed because of the skewedness of the histograms and the presence of at least two distinct environments in some samples.
Undoped silica was found to incorporate the most basic microenvironments, with Si-OH pKas around 7.5 and 4. Introducing tetrahedral Al atoms should produce acidic sites of decreased pKa because of the inducing effect of the negatively charged Al6. The observation of a new peak at higher ratios in the single molecule histogram data obtained from the Al-doped films is consistent with this expected increase in their acidity. By comparison of these results with the pH film data, the position of the new peak in the Al-doped films (R = 3.0 to 4.4) indicates this population had a pH value of around 4.5. In the histogram obtained from the 0% Al sample, the tail to higher ratios was small, indicating that the population of microenvironments with pH 4 was small. When Al was added, however, the second peak started to appear, suggesting that the doping of Al created more microenvironments with pH around 4.5. It is believed these more acidic sites replace weaker Si-OH sites in the films.
The predominant peak in the 0% Al samples was attributed to pKa 7.5 ÐSiOH groups. Upon incorporation of Al dopant, the center of this peak shifted to smaller values of R. This shift is attributed to sites with pH<4 because Al incorporation increases Brznsted acidity. The shift of the average of the major peak to smaller values of R indicated that the number of microenvironments with pH values smaller than 3 increased with increased Al doping and these sites likely originated from acidic (i.e., pKa = 4) ÐSiOH groups.
This research is important because it provides information on the distribution of Brznsted acidity in solids that cannot be obtained by conventional techniques. This research demonstrates that the SMS method can characterize the heterogeneity of solid acid catalysts.
References
1 B. E. Yoldas, J. Mater. Sci., 1977, 12, 1203-1208.
2 R. Nass and H. Schmidt, J. Non Cryst. Solids, 1990, 121, 329-333.
3 C. S. Owen, et al., J. Fluoresc., 1992, 2, 75-80.
4 M. L. Hair, J. Non Cryst. Solids, 1975, 19, 299-309.
5 S. Ong, et al., Chem. Phys. Lett., 1992, 191, 327-335.
6 Y. Inaki, et al., J. Phys. Chem. B, 2002, 106, 9098-9106.