Reports: ND648876-ND6: Frequency-Based Optical Spectroscopy
 printer friendly
We have measured the effects of nitrogen collisions on the line shape at various pressures and temperatures between 125 K and 296 K for lines in the ν1 + ν3 combination band of acetylene near 1.526 μm. The data provide information for a critical analysis of the reliability of commonly used line shape model functions for the extraction of species concentrations from remote spectroscopic measurements. Analysis shows that the observations cannot be fit reliably by commonly used line shape functions such as the Voigt, hard-collision (Rautian-Sobelman) or soft-collision (Galatry), that do not take into account the speed dependence of the collisional broadening. While portions of the data might be satisfactorily reproduced, in all these cases, the best model fits show systematic devations from the measured line shape that are greater, in some cases by large amounts, than the measurement uncertainties in certain pressure/temperature regimes. The use of these line shape models would result in systematic errors in species concentration profiles extracted from the measured line shapes.
However, the simplest speed-dependent lineshape model, the speed-dependent Voigt (SDV), was found to adequately reproduce all the data over the full range of temperatures, pressures and gas concentrations. This model includes a pressure broadening parameter (γ), a pressure-dependent shift (δ) and the exponent of an effective intermolecular potential of the form V=aR-q. Parameters representing both the self-collisions between two absorber molecules and those representing absorber-perturber collisions are required to account for the full range of relative concentrations in the data. Their contributions are scaled according to the partial pressures of the gases in the sample. In addition, the broadening and shift parameters are temperature dependent. In the past, data for differerent temperatures were fit independently. However, we have developed a new multispectrum fitting code written in MatLab that permits the fitting of data for all temperatures simultaneously using a model form[1] for the broadening and shift parameter temperature dependencies as
| (1) |
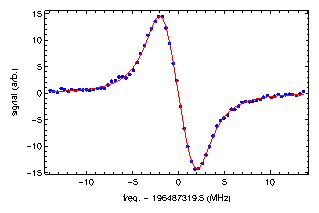
While much of the work has been directed towards the measurement of Doppler and pressure broadened lines for remote sensing applications, we are currently working towards routine measurement of sub-Doppler spectra. Such measurements are needed because under normal conditions, many spectral lines are overlapped and an apparent single feature in the spectrum observed under ambient conditions may contain contributions from multiple different features. In order to satisfactorily model the observed feature, an accurate knowledge of the rest frequencies for the underlying components is needed. Theory may provide these numbers in some cases, but in others, the models are insufficiently precise, and uncertainties in the component positions can lead to errors in species concentration profiles extracted from field measurements. Figure 1 shows an example of the recent saturation-dip sub-Doppler measurements in our laboratory.
Figure 1:
Sub-Doppler measurement of the P(1) line in the ν1+ν3 combination band of acetylene recorded in the Stony Brook laboratory. The solid line is a fit to the derivative of the Lorentzian profile. In the Doppler limited spectrum, this line is overlapped by R(10) of the ν4 + ν5 hot band line. Actual frequency accuracy is approximately 30kHz.p
In addition, line mixing[2] effects will be important in regions where there are closely-spaced lines that share common rotational levels. Such effects also lead to asymmetric line shapes, further complicating species profile retrievals. A crucial first step is the measurement of the absolute frequencies for the unresolved components of all the important lines in the spectrum, then the interplay between line mixing effects and asymmetry resulting from speed-dependent line shape effects can be critically assessed. Future work in this direction is planned in the 2ν3 methane spectrum that is of interest for quantifying methane profiles in both the earth's atmosphere and in extraterrestial environments.
References
- [1]
-
A. Valentin, A. Henry, C. Claveau, D. Hurtmans, and A. W. Mantz. Line profile study down to 80K of R(7) in the 13CO (1-0) band perturbed by Ar and 13CO collisional cooling with He at 6.9K. Molec. Phys., 102(16-17):1793-1802, 2004.
- [2]
- Chris D. Boone, Kaley A. Walker, and Peter F. Bernath. An efficient analytical approach for calculating line mixing in atmospheric remote sensing applications. J. Quant. Spectrosc. Rad. Transf., 112(6):980-989, APR 2011.
File translated from TEX by TTH, version 4.01.
On 16 Oct 2012, 13:27.