Reports: DNI651521-DNI6: Testing Models of Multi-Component Diffusion and Spin Relaxation in Porous Media under Radio Frequency Excitation in NMR
 printer friendly
Our current research has begun to characterize the
diffusion and aggregation processes (AIM
IIA) for a "simple" dye, sunset yellow. We have also developed algorithms to
efficiently search for relaxation selective pulses (AIM IIB), which can be used to constrain aggregation models used to
model the data from AIM IIA.
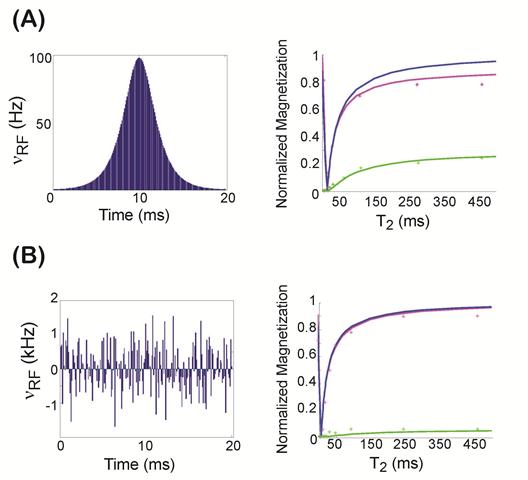
Fig. 1. (A) Initial 20ms Soliton Pulse (left) along (right) with the magnetization profile after application of the soliton pulse vs. T2 (ms). The theoretical z (purple) and transverse (green) magnetizations, and Mtarget (blue, T2sel=15 ms) profiles are plotted (right) along with the experimental results (*). There was significant deviation of M from Mtarget. (B) The optimized pulse found from our algorithms. The magnetization profile from the optimized pulse was close to Mtarget.
Future Directions:
Our group will employ the current pulse sequence algorithms to find pulses
that are T2 selective while being robust to T1 (i.e., independent of a).
We will also incorporate diffusion into our algorithms along in order to
determine the necessary time-dependent pulsed field gradients that can be employed
to selectively zero magnetization based not only upon T1 and T2 but also upon the
value of the diffusion coefficients.
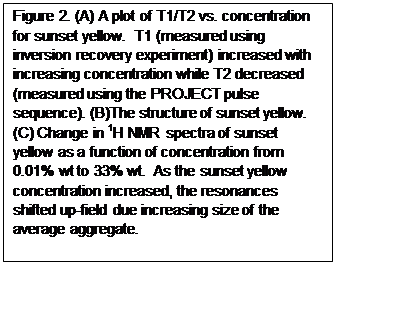
Figure 2. (A) A plot of T1/T2 vs. concentration for sunset yellow. T1 (measured using inversion recovery experiment) increased with increasing concentration while T2 decreased (measured using the PROJECT pulse sequence). (B)The structure of sunset yellow. (C) Change in 1H NMR spectra of sunset yellow as a function of concentration from 0.01% wt to 33% wt. As the sunset yellow concentration increased, the resonances shifted up-field due increasing size of the average aggregate.