Reports: UNI650746-UNI6: Rotational Spectroscopy Investigation of Interactions between Carbon Dioxide and N-containing Cyclic Compounds
 printer friendly
Introduction
In this project, our main goal is to measure, assign, and analyze the rotational spectra of van der Waals complexes of carbon dioxide with four nitrogen-containing cyclic molecules: pyrimidine, pyridazine, pyrazine, and imidazole. The purpose of this study is twofold. First, we hope to better guide the next generation of materials developed for carbon capture and storage (CCS). Second, this study will provide an important test of previously published theoretical data.
Summary
In the first year of this project, we have successfully completed the following tasks:
∙ Significantly upgraded the Coker College Fourier transform microwave (FTMW) spectrometer to allow for measurements of cold (~1K) molecular samples.
∙ Performed extensive testing of the upgraded spectrometer to assess its performance relative to instrumentation in the literature.
∙ Measured and analyzed three compounds unrelated to the grant, in order to showcase the capability of the upgraded spectrometer.
∙ Measured the spectra of several CO2-cyclic organic compounds, in pursuit of fulfilling the projects main goals.
Spectrometer Upgrade and Benchmarking
The first step in reaching our goal was to make significant modifications to Coker's room-temperature chirped-pulse Fourier transform microwave (RT-CP-FTMW) spectrometer. The purpose of these modifications was to convert the RT-CP-FTMW spectrometer into a CP-FTMW spectrometer which employed a high-vacuum chamber and a pulsed valve to collisionally cool molecular samples down to ~1K. This cooling is necessary in order to create the weakly-bound van der Waals complexes to be studied in the project. These modifications were made possible by the funding of this PRF grant. After relevant purchases were made, Coker students constructed the high-vacuum chamber and made all necessary modifications to the spectrometer in order to achieve a working pulsed-valve CP-FTMW spectrometer.
Significant time was spent testing the modified spectrometer during this first year of the grant. Students tested the signal-to-noise ratio versus a multitude of experimental parameters. After performing these tests, we are confident that the CP-FTMW spectrometer is operating at an optimal level (for the equipment that we own). Signal-to-noise ratios for a single valve pulse using a single microwave pulse are comparable to those of similar spectrometers as reported in the literature.
Experiments Performed
Our first three experiments with the new spectrometer were not directly related to the grant proposal, but rather "proof of principle" experiments to showcase the capabilities of the upgraded spectrometer. Figure 1 shows the pure rotational spectrum of 3-vinylbenzaldehyde (3-VBA) as measured by Coker's CP-FTMW spectrometer. For this measurement, the sample was heated to ~170�C inside of the pulsed valve and the carrier gas (70% Ne, 30% He) was flowed over the sample at a backing pressure of ~ 50 psi. The spectrum shown in Figure 1 was acquired by averaging 10,000 free induction decays (FIDs) and taking the Fourier transform of the averaged FIDs.
The spectrum of 3VBA has been fully assigned and analyzed. The analysis has uncovered rotational constants for four unique conformers of 3VBA. These rotational constants are shown in Table 1. Ab initio calculations have also been performed on all four of the conformers. A summary of the results of these calculations is shown in Table 2.
In two similar experiments, we have completed the measurement and analysis of the rotational spectrum of 3‑chlorobenzaldehyde and the measurement of the rotational spectrum of 2‑chlorobenzaldehyde.
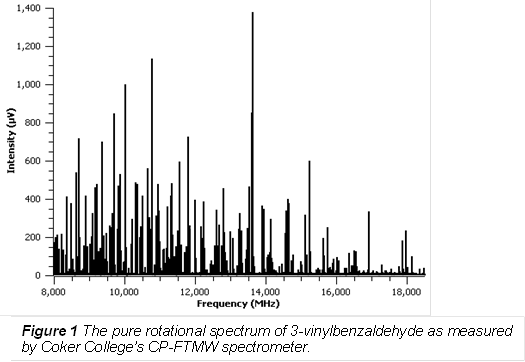
Table 1: Experimental Rotational Constants | ||||
Rotational Parameters | Conformation of 3-VBA | |||
trans, cis | trans, trans | cis, cis | cis, trans | |
A (MHz) | 2581.970 (9) | 3445.36 (5) | 1961.976 (2) | 2568.114 (1) |
B (MHz) | 890.5044 (4) | 782.0025 (6) | 1078.3769 (9) | 895.4393 (6) |
C (MHz) | 662.8601 (5) | 638.1554 (6) | 696.6559 (6) | 664.6527 (4) |
DJ (MHz) | 0.016 (0.00021) | 0.0099 (0.0018) | 0.061 (0.0060) | 0.023 (0.0027) |
DJK (MHz) |
|
| -0.25 (0.036) |
|
DK (MHz) | 7.4 (1.6) |
| 0.44 (0.055) | 0.87 (0.056) |
dJ (MHz) |
|
| 0.025 (0.0032) | 0.0059 (0.0016) |
Number of Assigned Lines | 60 | 54 | 101 | 114 |
OMC (MHz) | 0.017432 | 0.017434 | 0.025945 | 0.021288 |
Conformation of 3VBA | Table 2: Calculated Rotational Constants (MHz) | |||||
RHF | MP2 | M052X | B3LYP | Experimental | ||
3VBA-trans, cis (E= 0.47 relative kJ/mol) | A | 2619.3904 | 2565.2698 | 2611.958 | 2585.898 | 2581.970 |
B | 894.1425 | 885.7109 | 894.4371 | 886.2788 | 890.5044 | |
C | 666.5964 | 658.3889 | 666.2775 | 660.0547 | 662.8601 | |
3VBA-trans, trans (E= 0.79 relative kJ/mol) | A | 3476.0821 | 3434.034 | 3480.3131 | 3444.9736 | 3445.36 |
B | 788.0867 | 776.8244 | 786.8768 | 779.6972 | 782.0025 | |
C | 642.4357 | 633.5149 | 641.7754 | 635.7979 | 638.1554 | |
3VBA-cis, cis (E= 0.38 relative kJ/mol) | A | 1995.0781 | 1948.1814 | 1976.8594 | 1966.5562 | 1961.976 |
B | 1078.5718 | 1073.8563 | 1085.7597 | 1070.6103 | 1078.3769 | |
C | 700.0911 | 692.2703 | 700.8362 | 693.2169 | 696.6559 | |
3VBA-cis,trans (E= 0 relative kJ/mol) | A | 2595.7585 | 2524.3413 | 2580.2107 | 2567.6954 | 2568.114 |
B | 901.4639 | 895.989 | 903.0085 | 892.0929 | 895.4393 | |
C | 669.0974 | 666.7368 | 668.9077 | 662.0702 | 664.6527 | |
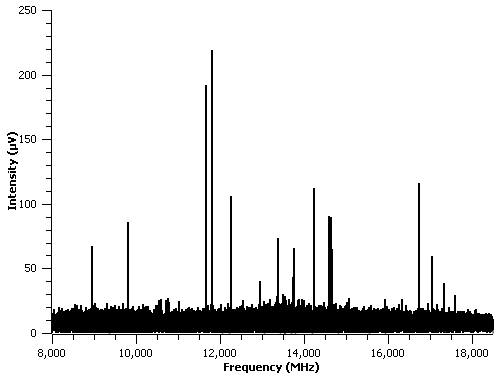
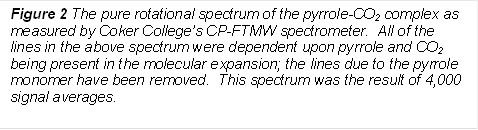
The main focus of the project is the study of carbon dioxide complexes with cyclic organic compounds. In this area, we have done preliminary work on a number of CO2 complexes, including those involving the following cyclic organic rings: pyrazine, pyrimidine, pyridazine, pyrrole, and furan. The last two in the above list were not included in the grant proposal, but they were used as test-cases for carbon dioxide complexes. In particular, we have identified a number of lines in the spectra of pyrrole-CO2 and pyridazine-CO2 that are not present when CO2 is removed from the molecular expansion. For example, Figure 2 shows the spectrum of only those lines that are present when both pyrrole and CO2 are present in the molecular expansion. For this figure, the spectrum of pyrrole was measured without CO2 present in the carrier gas, and all of the lines from the pure pyrrole spectrum were removed from the spectrum of the pyrrole-CO2 mixture. The spectrum shown in Figure 2 is the result of 4,000 signal averages. We have not yet analyzed this spectrum.
 |