Reports: UR1051438-UR10: Geometrically Cohesive Granular Materials: Experiment and Simulation
 printer friendly
We have made significant progress in the two primary goals of our project: 1) an experimental investigation into the extensional rheology of U-shaped staples and 2) developing parallelized molecular dynamics code that runs on a graphics processing unit (GPU).
Experimental Findings
Stress-strain experiments subject a cylindrical pile of U-shaped
staples (diameter d and initial length L to an axial
stress that, in the absence of deformation, increases linearly. Pile
deformations are measured to sub-millimeter accuracy, and a force
transducer that is rigidly in-line with the pile axis measures the
applied force to ~.01N. The force fluctuates; increasing as the pile
is nominally at rest and dropping sharply when the pile elongates.
Analysis code extracts the critical points in the force data and the
statistics of these events analyzed. As it is not clear that the
normalized quantities stress and strain are in fact appropriate, we
continue to report the applied force and pile elongation.
In Figure 1(left) the applied force is plotted as a function of pile
elongation. We find significant plastic "creep" --- periods where the
pile slowly grows slowly with increasing force. This contradicts the
naive interpretation of a pile that deforms only elastically until
suddenly yielding. The red line in Fig. 1(left) is a linear
interpolation between the critical points found by the analysis
software. This allows us to extract, for example, the distribution of
creep moduli (slopes of the upward lines), as shown in Fig. 1(right).
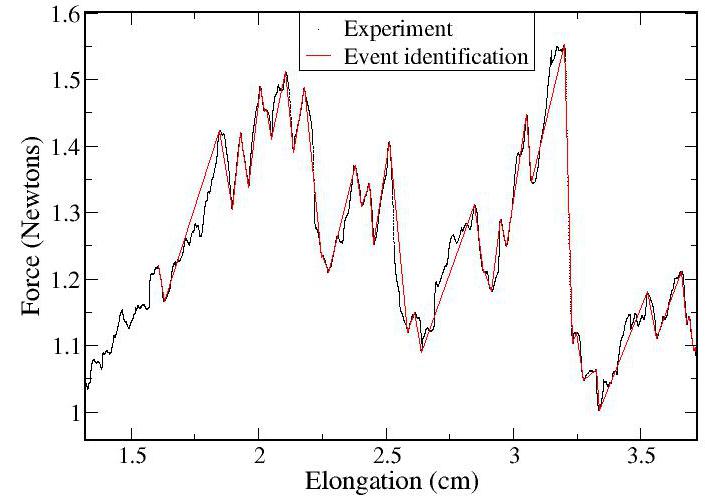 | 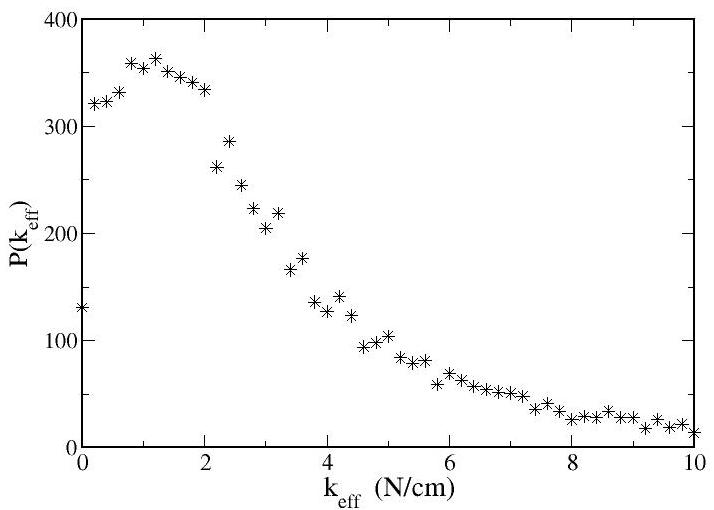 |
Figure 1: (Left)Experimentally applied force as a function of pile length. The pile shows significant plastic creep as well as sudden bursts of elongation. (Right)Distribution of creep moduli (slopes of the upward lines). |
We have confirmed that the distribution of event characteristics ---
measured as either the increase in length, drop in applied force, or
yield force --- does not depend significantly on the pile history.
Specifically, the distribution after largest event is
indistinguishable from the distribution before this event.
The most intriguing finding to date is that longer piles are
significantly weaker than short piles. In Figure 2(left) is plotted
the maximum force (throughout a single experiment) as a function of
the initial pile length. Short piles (<3cm) require forces of 4-5
Newtons to ultimately break, whereas longer piles (>5cm) require only
2 N. The drop appears well-fit by a stretched exponential (red line).
The underlying mechanism of the functional form, as well as the
inflection point (which is of order the pile's diameter) is unknown.
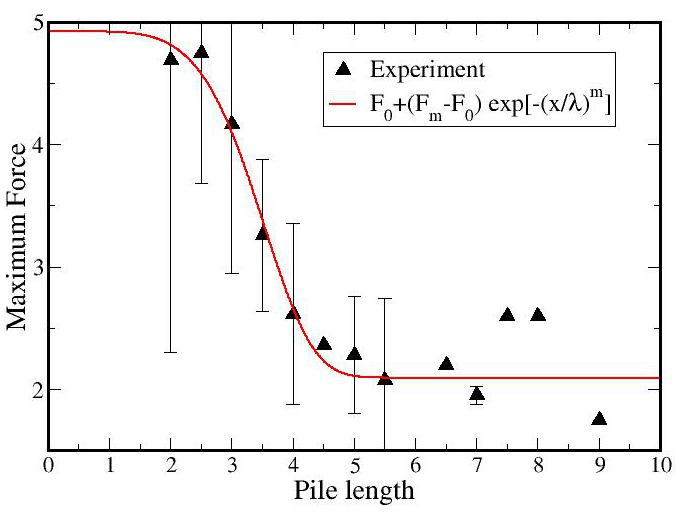 | 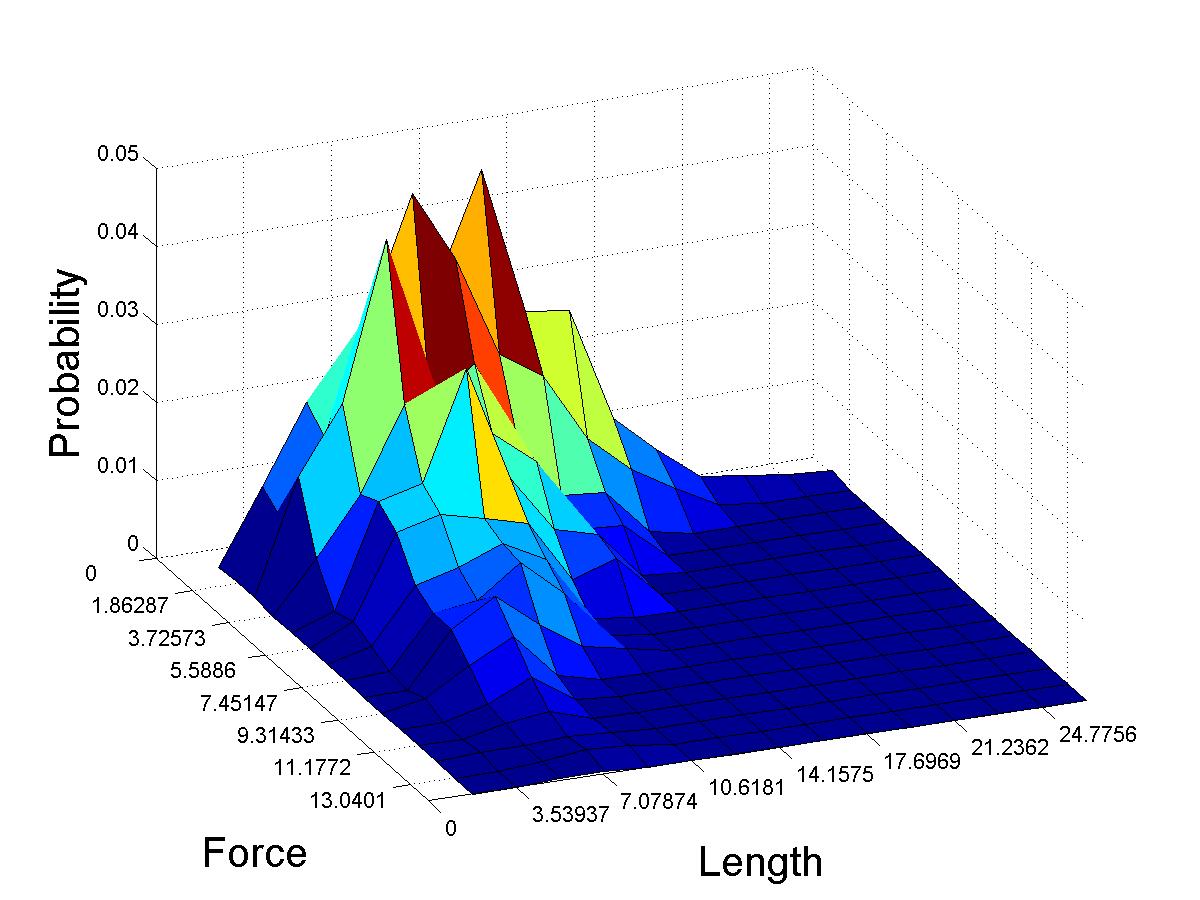 |
Figure 2: (Left)Maximum force applied during a given experiment vs. the pile's initial length. At a length of 3-5 cm the pile weakens significantly. The functional form appears well-fit by a stretched exponential (red line). (Right)2-dimensional probability distribution of yield force and actual (not initial) pile length. The distribution enables an application of Weibullian (weakest-link) statistics. |
We are currently applying a weakest-link theory to the yield. This incorporates Weibull statistics, which posits that there is a fundamental lengthscale, and long piles are composed of a discrete number these sub-units. Our data indicates that the pile is not rearranging in a significant manner as it lengthens, and hence a single experiment with multiple yield point accurately samples a number of different pile lengths. By integrating the 2-dimensional probability distribution function P(F,L) (Figure 2(right)) across a given length we can predict the distribution of yield forces at specific actual length. This work is currently in progress.
Computational Work
We have written 2d molecular dynamics code that simulates the shear of
"spherostaples" --- U-shaped particles composed of three
spherocylinders (Fig. 3(left)). The contact detection of
spherocylinders can be expressed analytically, and so is well-suited
for parallelization. Our current implementation is for a few thousand
particles, and so it is possible to assign each particle pair to a
separate GPU thread, enabling extremely efficient code. The scaling
of computational time with number of particles comparing Matlab, C,
and parallelized GPU code is shown in Fig. 3(right). The scale in
Fig. 3(right) is log-log; the GPU code (green triangles) is
approximately 2 orders of magnitude faster than Matlab or C code, and
makes possible 2- and 3-d simulations of these complex particles.
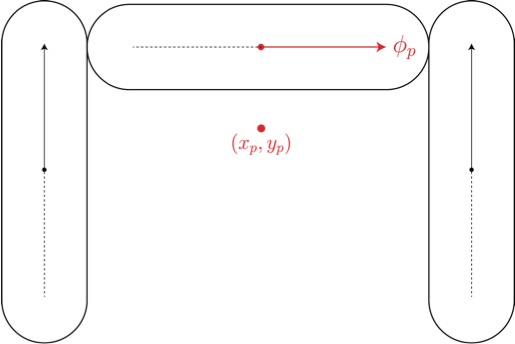 | 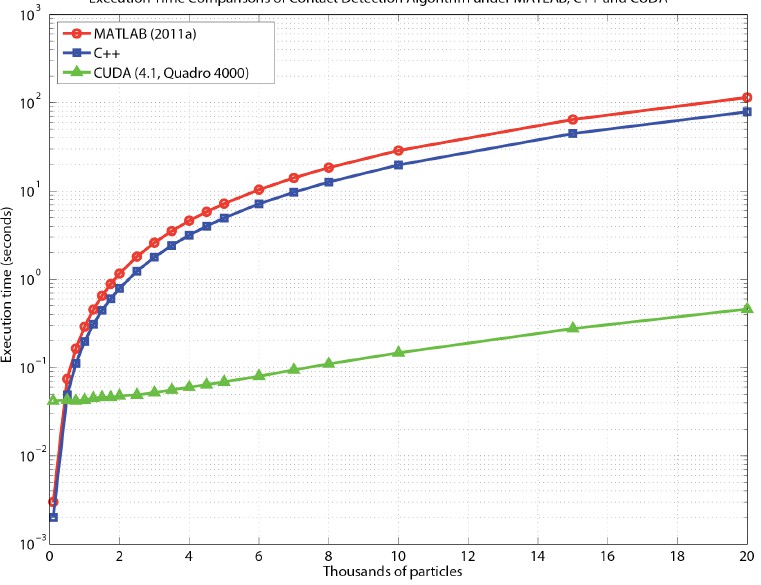 |
Figure 3: (Left)Spherostaple comprised of three spherocylinders at right angles. (Right)Computer time to detect contacts as a function of number of particles. Shown are results from Matlab, C, and parallelized GPU code. For relevant numbers of particles (2-3 thousand) the GPU code is 10-100 times faster than either linear methods. |