Reports: ND549192-ND5: Development of a Scattering Characterization Technique to Study the Nucleation and Growth Mechanism of Supported Metals
 printer friendly
During this reporting period the graduate student Liliana Gamez has been working on the analysis of the in situ pair distribution function (PDF) data obtained from the 2.5% wt Pt-zeolite X sample during oxidation and reduction and preparation of a manuscript for publication that is currently being revised.
Figure 1 shows the Pt differential pair distribution function (d-PDFs) of the sample during oxidation as the temperature rose up to 350°C. These d-PDFs were obtained by directly subtracting the zeolite support PDF from the reduced PDF at the corresponding temperature to isolate the Pt contribution and eliminate the effect of heating on the structure of faujasite. Two peaks at 2.25 Å and at 3.1 Å appeared around 200 °C to 300°C. These peaks are correspond to the Pt-O and Pt-Al/Si interatomic distances as identified previously. The absence of Pt-Pt peaks during this calcination process shows that no reduction of platinum has occurred suggesting that the thermal process does not induce precursor reduction.
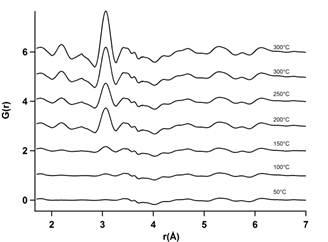
Figure 1. Differential PDFs during in situ calcination between 50°C and 300°C
Figure 2, on the other hand, shows the changes in the d-PDFs that occur during the in situ reduction of the oxidized sample with temperature. At temperatures below 180 °C the PDFs show the two peaks observed during oxidation while a peak centered around 2.7 Å starts to appear at around 170°C corresponding to the Pt-Pt distance. As temperature increases more peaks start to appear at higher interatomic distances where the location of the intensity falloff can be used to determine the core size with structural coherence. By direct observation, from 160 to 210°C the Pt structure core has two peaks centered at 2.67 Å and 4.65 Å. In the region between 220 °C and 290 °C peaks to 7.02 Å and from 300 °C, peaks up to 22 Å.
To determine the Pt particle size quantitatively the d-PDFs were used to refine the Pt fcc unit cell from 180°C to 350°C. The best fit was obtained when a slight deformation of the lattice parameters was allowed that made the cell orthorhombic instead of cubic while leaving the lattice angles and atomic positions constant. Using this allowance a residuals ranging from 29% to 39% were obtained at all the studied temperatures. While this might seem like a high residual it should be considered that a standard R of less than 30% is considered acceptable for regular PDFs. Since here d-PDFs are used an increase in the residual was expected due to the higher noise obtained during substraction. Below 180°C the residuals increase significantly mainly due to the presence of the Pt-O and Pt-Al/Si peaks that cannot be fitted with the structural model used.
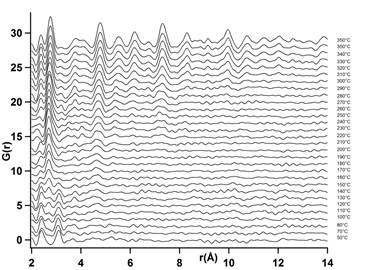
Figure 2. Differential PDFs during in situ reduction between 50 to 350°C
Figure 3 shows the behavior of particle size with time during reduction. In it three zones can be identified above 180°C: from 180°C to 250°C (Zone I), from 250°C -315°C (Zone II) and from 315°C to 350°C (Zone III). Zone I is characterized by a slow increase in size with time/temperature. Zone II is characterized by a fast increase in size with time/temperature and Zone III again is characterized by a slow increase in size with temperature. Zone I is consistent with either a nucleation type process until a critical radius of 13 Å is obtained but it is also consistent with a diffusion limited growth. Zone II is consistent with a fast growth of the nanoparticles and Zone III is consistent with a slow growth. If it is taken into consideration that the size of the supercage of the zeolite is 13 Å then the growth taking place in Zone II and III is either breaking the zeolite framework or occurring on the surface of the zeolite. Either way this growth is generally undesired in this system as it is unconstrained.
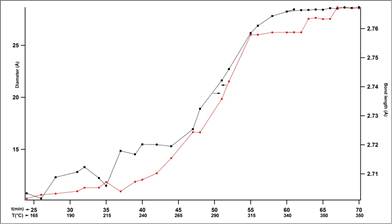
Figure 3. Particle diameter(red) and average Pt-Pt bond length(black) changes with time and temperature.
Figure 3 also shows that the average closest neighbor Pt-Pt distance follows the same trend of particle size with time/temperature. This behavior is typical of nanoparticles. In this experiment it can be observed that at 315°C, when the particle has reached an average size of 26 Å, the Pt-Pt average distance reaches the bulk value of 2.77 Å and remains constant thereafter.
To better understand what happens below 180°C, when the Pt-O and Pt-Si/Al peaks are present, a graph of area of these two peaks were obtained with temperature/time (Figure 4). It shows a steady decrease in the Pt-O peak area from 50°C to 250°C an increase in the area from 250°C to 300°C and a plateau at higher temperatures. Meanwhile the Pt-Si/Al peak is reduced from 50°C to 165°C, plateaus from 165°C and 265°C and changes slightly from 265°C to 350°C. Interpretation of the behavior of the Pt-O peak area is complicated by the fact that there are two contributions to this peak: the oxidation of the platinum that presumably occurs during calcination and the coordination of the Pt to the zeolite oxygen atoms. However, reduction of the area of both Pt-O and Pt-Si/Al peaks from 50°C to 250°C is consistent with diffusion of the Pt particles from the walls of the zeolite to form nanoparticles.
The fact that from 250°C-315°C there is a decrease in the area of the first Pt-Pt peak (included in this figure), and an increase in the area of the Pt-O and Pt-Si/Al peaks suggest that at this temperature some Pt atoms are somehow leaving a nanoparticle and coordinating with the zeolite. This would suggest that the rapid growth observed at these temperatures in Zone II above, vide supra, is facilitated by the rupturing of some of the nanoparticles. The behavior above 315°C suggests that the growth occurs by some type of agglomeration that does not involve rupturing.

Figure 4. Changes in the areas of the Pt-O, Pt-Si/Al, first and second Pt-Pt peaks with temperature/time.
A second article is in preparation analyzing the structural changes ocurring on zeolite X with temperature.