AmericanChemicalSociety.com
Reports: AC3 48286-AC3: Characterization of Actinide - Ligand Bonding
Chemical bonding may be described in terms of the distribution of the valence electrons in a molecule. The X-ray diffraction experiment, through the Fourier transform of measured structure factors, contains the distribution of the total electron density modified by thermal motion. For light atom structures, the valence electron count is a significant part of the total electron count. However, for elements as heavy as the actinides, the X-ray scattering is dominated by the core electrons. Hence, even for quite simple compounds, the requirements on data quality are extreme. In addition, although the modeling of the electron density via a multipolar expansion for light atoms is well established, there is no body of knowledge regarding the best functions to use for heavy elements. In this funding period, we have concentrated on improving our data by adding more sophisticated profile fitting to the data integration software, improved our program for absorption corrections by incorporating digital images of the crystal, and explored approaches to superimpose multipolar expansions in order to model the electron density of very heavy elements including core polarization.
The most important addition to the data integration program VIIPP is the introduction of the use of separate profiles for the Kα1 and Kα2 contributions to the Bragg reflections during the profile fitting procedure. We have tested the improvement in the data integration program by reintegrating existing data sets for light atom structures, and refining the electron density model as before. The improvement is manifest in the ability to refine, not only the multipole expansion for the electron density, but also include the anharmonic thermal motion of the non-hydrogen atoms as well as the anisotropic motion of the hydrogens. In one striking case, we were even able to do this for a room temperature data set for a compound with only C, H, N, and O atoms. A paper describing this work has been submitted to Acta Cryst. A.
We had previously reported a proof of principle experiment on Cs2UO2Cl4 crystals. We now have three data sets on different crystals collected at 20 K. These repeat measurements were carried out to ensure that any subtle features of the electron density were not artifacts of the experiment. The refinement strategies are described below.
For heavy atom structures, the correction of the observed data for the effects of absorption is essential, even for the very small crystals that we are using (~60μ). We have modified our absorption program (CCDABS) to reconstruct the crystal shape from 73 digital photographs of the crystal taken every 5º of rotation at the experimental temperature, followed by numerical integration over a 40x40x40 point grid. The effectiveness of this procedure may be judged by the merging R value of 1.48% with an average multiplicity of 10.
Within the XD program that we use for fitting the multipole electron density model, there are many options for building the model for an atom as heavy as uranium. None of these has been previously tested with real data, hence we have spent a significant amount of time exploring different refinement strategies. Currently, we believe that the most reliable models are as follows. The first one (“single U”) uses a regular description of the uranium atom consisting of core and valence shell, with a single radial function calculated from a combination of the electronic configurations 7s2, 6d1 and 5f3. The second one (“split” model) uses four components at the uranium position: a core from the single U model with the 6s function allowed to be part of the valence set (thus providing a mechanism to allow polarization of the core) and three no-core atoms with expansions based on 7s, 6d, or 5f radial functions in the valence shell. In the second case atomic coordinates, all thermal parameters and kappa values were constrained to be the same for all four components during the refinement. A comparison of deformation density, residual and Laplacian maps is given in Fig.1-2, suggesting that the split model is to be preferred. The figures are in agreement with the characterization of the U – O bond as a triple bond.
Topological analysis of the total electron density has been carried out. The following integrated charges were obtained for the single-U model (charges for the split model are not yet obtainable with current software) – U = 2.59, Cs = 0.95, Cl = -0.62, O = -0.95. The electron density at the bond critical points follow the anticipated bond strengths – U – O, 1.533 (1.445) eÅ-3, U – Cl, 0.500 (0.495) eÅ-3, Cs – Cl, 0.075 (0.066) eÅ-3. Values are for the split model, with the single U model in parentheses. The value for Cs – Cl is the average of four interactions.
This work was presented at the Gordon Research Conference on Electron Distribution and Chemical Bonding (July 11-15, 2010) and at the American Crystallographic Association Meeting (July 24-29, 2010).
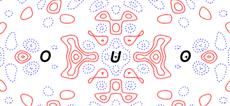
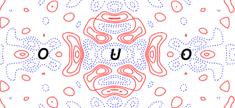
Fig.1 Residual maps in U-O-U planes for “split” model (left) and “single” model (right). Contour values are 0.1 e/Å3. Red are the positive contours, blue are the negative ones.
Fig.2. The deformation density and Laplacian maps for Cs2UO2Cl4 in U-O-U plane. Deformation density contours are at 0.05 e/ Å3 - positive are red, negative are blue. Laplacian contours vary - violet ones correspond to positive a Laplacian.
