AmericanChemicalSociety.com
Reports: UR5 49516-UR5: Determination of Surface Mole Fractions in Mixed Binary AlkaneThiol Self-Assembled Monolayer Films on Gold by Thin-Layer Electrochemical Mass Spectrometry
Introduction. The focus of this research is to examine the feasibility of using electrospray ionization mass spectrometry (ESI-MS) as a quantitative tool for mixed n-alkanethiol self-assembled monolayers (SAMs). With detection limits in the pmol range, ESI sources are able to generate quantities of gas-phase ions that are well within the range expected for SAMs (alkanethiol surface coverage = 7.7 pmol/mm2). So long as adsorbate desorption leads to an electroactively stable species and to effluent concentrations large enough to be detected, quantification of SAMs by ESI-MS should be realizable. Since alkanethiols tend to spontaneously oxidize in solution, all analyses have focused on negative ion MS of the most stable oxidation product (alkylsulfonates, RSO3-) produced by reaction with H2O2. The weak Au-sulfonate interaction and high electron affinity of the sulfonate group should facilitate removal of the film and formation of the molecular anion.
These studies will significantly advance the use of MS as a quantitative tool for SAMs, as our approach should be applicable to SAMs more complex than those investigated here. From a professional standpoint, this work has allowed me to expand my analytical capabilities into new areas (quantitative MS). Students working on this project are gaining invaluable experience learning how to apply an important analytical tool (quantitative MS) to a problem of fundamental interest (quantifying film compositions).
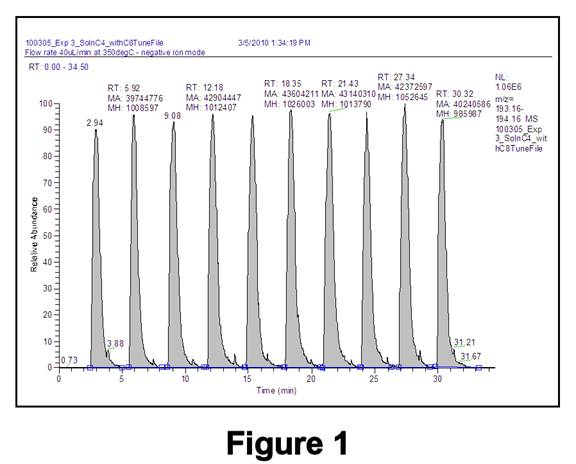
MS Calibration Data. To examine matrix effects for mixed SAMs, mixtures of n-decanethiol (C10H21SH = C10SH) with n-octanethiol (C8SH) or n-butanethiol (C4SH) were studied. Having similar chain lengths, C10SH and C8SH were expected to exhibit similar linear dynamic ranges (LDRs) and detection limits (DLs); C10SH and C4SH were expected to be more dissimilar. Standard solutions were prepared in ethanol by serial dilution of C10SH, C8SH, C4SH, or a mixture of C10SH with C8SH or C4SH; n-pentanethiol (C5SH) was added as an internal standard (IS). Excess H2O2 (5 eqvs) was included in all solutions to oxidize all thiols (including the IS) to sulfonates, and all solutions were buffered with 1.0 mM CH3COONH4. Data were acquired by performing 8-10 injections of each standard (using a 20-microliter sample injection loop) into a 40 microliter/min stream of ethanol. MS data collection involved measuring the integrated signal for C10SO3- (m/z 221), C8SO3- (m/z 193), C4SO3- (m/z 137), and C5SO3- (m/z 151) for each injection (Figure 1) and plotting the logarithm of the integrated signal ratios.
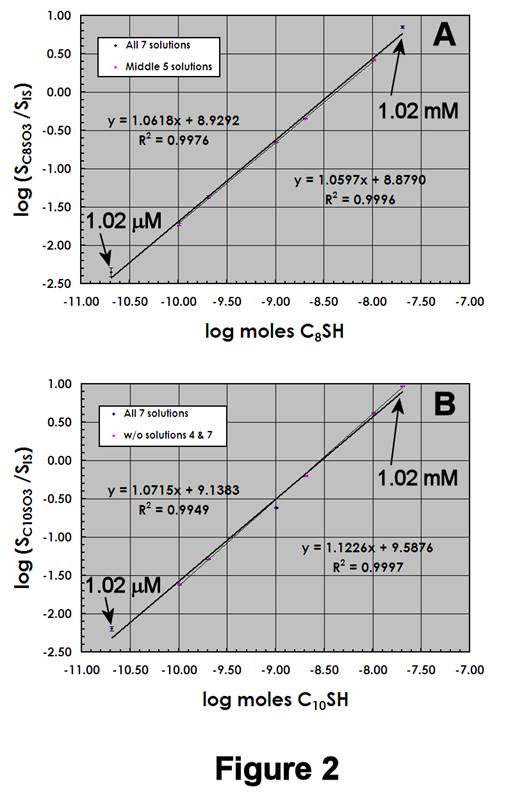
Figures 2A,B display ESI-MS calibration data for C8SH and C10SH, respectively, using 1.00 mM IS. The LDR for each compound is shown, as well as the 95% confidence intervals for each standard. As expected, the instrument response for both species is similar, although the calibration sensitivity for C10SO3- is slightly larger than C8SO3-. The high quality of the data is evidenced by the narrow confidence intervals and DLs near 20-30 pmol.
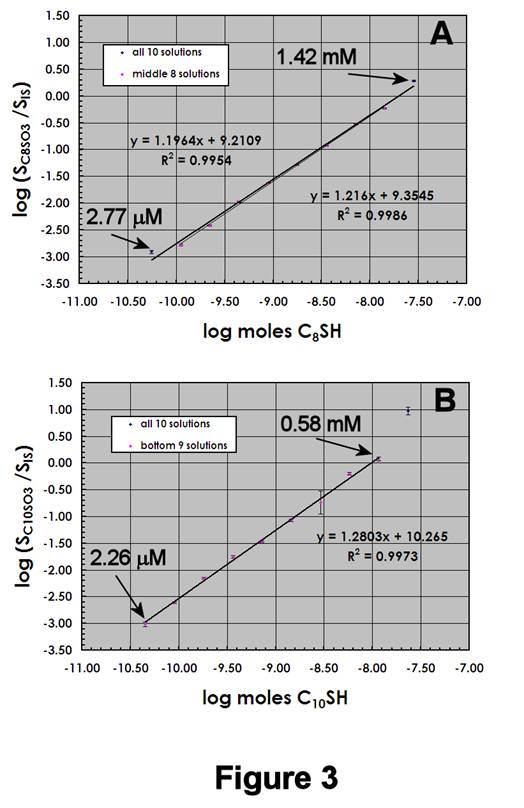
Figures 3A,B display the ESI-MS calibration data for C8SH/C10SH mixtures, using 1.19 mM IS. Again, the C8SO3- and C10SO3- data appear similar, with the difference in calibration sensitivities nearly identical to that in Figure 2. Several differences are notable: (1) C8SH/C10SH mixtures exhibit slightly higher DLs (~40-50 pmol); (2) C8SH/C10SH mixtures exhibit larger calibration sensitivities; and (3) the overall calibration regions have shifted downward on the log(signal ratio) axis. These differences demonstrate that accurate quantification of mixed SAMs requires standards whose compositions reflect those of the SAMs being studied.
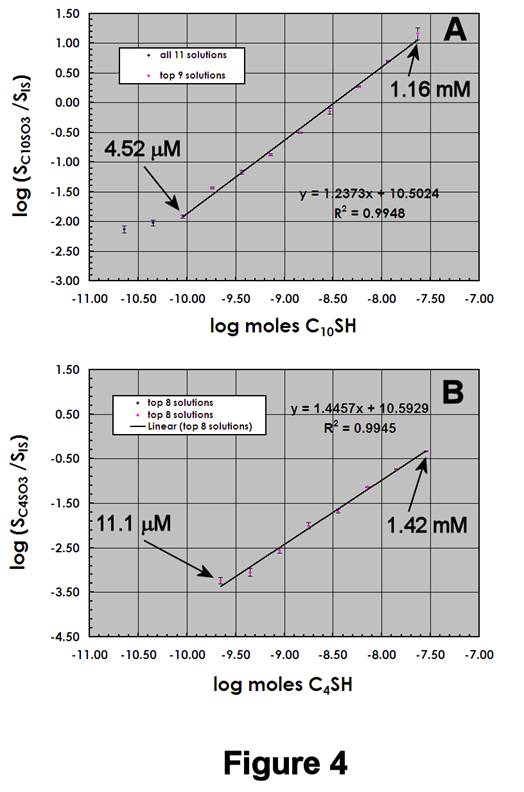
Figures 4A,B display the ESI-MS calibration data for C4SH/C10SH mixtures, using 1.19 mM IS. Note that the C4SO3- calibration sensitivity is 15-20% larger than that for C10SO3-, and that the DL for C4SO3- is ~10-5 M. We attribute the decrease in LDR to increased homolytic C-S bond cleavage in C4SO3-, which is evidenced by an increase in the signal for sulfur trioxide radical anion (·SO3-, m/z 80) (data not shown).
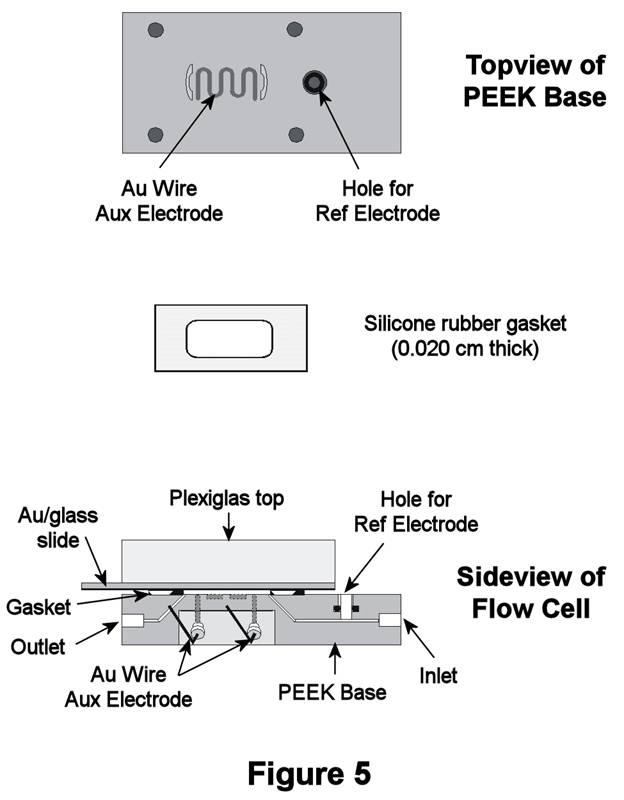
Thin-Layer Flow Cell Studies. A commercial thin-layer electrochemical flow cell (Figure 5, ElectrochemicalALD, LLC) was employed for our initial studies of oxidative removal of alkanethiol SAMs. This design exposes 4-cm2 of a SAM-coated Au/glass slide to solution and has a very low volume (50-100 microliters). Total alkanethiol concentrations generated with this cell are 30-50 micromolar, which is well within the LDRs shown above. Initially, the cell potential was stepped to values corresponding to oxidative desorption of the SAM (as sulfonates). These potentials, however, also coincide with solvent oxidation, which resulted in the generation of O2 bubbles within the cell (even for short excursions). Unfortunately, bubble formation severely compromised our ability to quantify the oxidation products.
A second approach employed H2O2 as a direct chemical oxidant of the film. In this method, the SAM was exposed to an ethanolic 10% v/v H2O2 solution, after which time the solution layer was flushed to the ESI-MS for detection. Oxidation using H2O2 avoided bubble formation and proved to be the most straightforward way to oxidatively remove the SAM.
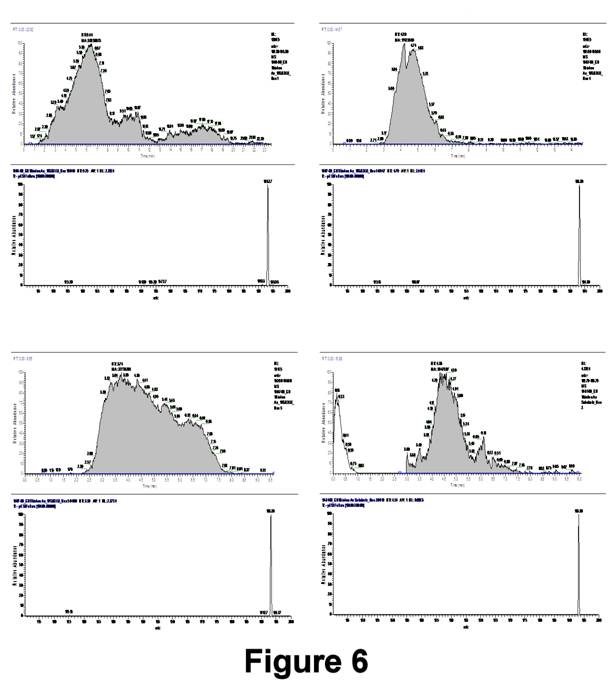
Figure 6 displays integrated MS data of C8SH SAMs using this approach. Although mass spectra have shown that only the fully oxidized product C8SO3- is formed, dead-volume mixing and trapping resulted in broadening of its signal. Quantification of the integrated signal for these experiments is shown in Table I, where the percent relative error was determined by comparison to the moles of C8SH expected to adsorb in a (√3x√3)R30° arrangement on a 4-cm2 Au(111) substrate:
TABLE I: Preliminary Quantitative Mass Spectral Results for C8SH SAMs | |||
Run # | SC8SO3 (integrated) | Mols C8SO3- | % Rel Error |
1 | 39755157 | 4.25E-09 | 46.7% |
2 | 56660473 | 5.93E-09 | 105% |
3 | 17418811 | 1.95E-09 | -32.7% |
4 | 27736281 | 3.02E-09 | 4.40% |
5 | 35985382 | 3.87E-09 | 33.5% |
The reproducibility with this TLFC is poor and the calculated quantities (on average) are in excess compared to the amount expected. Excess alkanethiol may result from inefficient rinsing of the substrate following SAM formation or surface roughness effects.
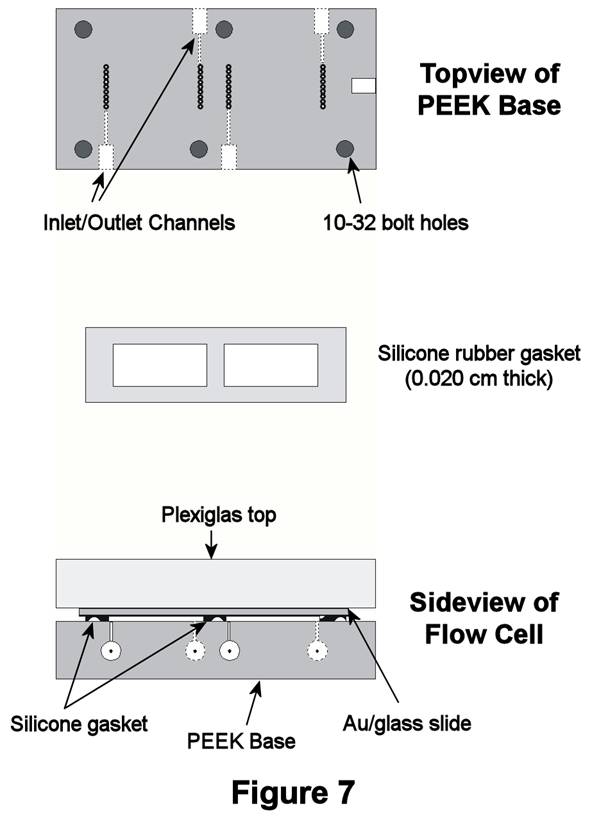
Significant modifications
have now been made to the TLFC design (Figure 7). In the new design, channel
sizes have been reduced to minimize dead-volume mixing and trapping of
analyte. Also, the new design allows one to make two measurements from a
single Au/glass substrate. Future work will focus on using this reconfigured
TLFC for our SAM work.
|
|
|
|
|
|
|