AmericanChemicalSociety.com
Reports: DNI6 49931-DNI6: Two-Dimensional Raman Spectroscopy of Metallocenes: Probing the Dynamics of Organometallic Bonds
In the first year of our PRF funding, we have made significant progress towards the goal of the proposal: to develop two-dimensional femtosecond stimulated Raman spectroscopy (2D-FSRS) as a tool to measure anharmonic vibrational coupling in hydrocarbons and metallocenes. Towards this end, we have developed a quantitatively accurate classical theory of 2D-FSRS and published theoretical and experimental results probing two different solvent systems, acetonitrile and chloroform (Wilson, 2009; Mehlenbacher, 2009). PRF funds have been used to support two graduate students, Kristina Wilson and Barbara Dunlop, and have allowed the purchase of a new CCD detector that will make the next 2D-FSRS experiments possible. Students and the PI are currently developing new experimental methodologies so that 2D-FSRS experiments will be able to measure the fifth-order Raman signal that is proportional to anharmonic coupling.
Our new method, 2D-FSRS, can potentially observe molecular anharmonicity by measuring the modulation of the frequency of a probed Raman mode, at frequency whi, by the coherent motion of an impulsively driven mode, at frequency wlow (See Figure 1).
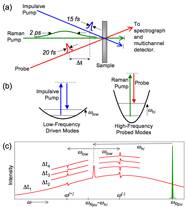
FIGURE 1. (a) Schematic of 2D-FSRS experiment. (b) The
impulsive pump drives a low-frequency mode into coherence, and the Raman pump
and probe together take a stimulated Raman spectrum of the sample. (c) The
detected spectrum of the probe measures the interaction between the impulsively
driven modes and the modes probed by FSRS. In the presence of anharmonic coupling
between the driven (wlow) and probed (whi) modes or via a coherent cascade, sidebands are
observed in the stimulated Raman spectrum at Raman shifts of w=w(+)=wRpu-(whi+wlow) and w=w(-)=wRpu-(whi-wlow). The phase of the sideband field varies with changes
in time delay, Dt, and produces
a time dependent lineshape. In acetonitrile the signal is generated by driving the CCN
bend (379 cm-1) and CC stretch (920 cm-1) into coherence
via impulsive stimulated Raman scattering and subsequently probing the
stimulated Raman spectrum of the CC stretch, the CN stretch (2250 cm-1)
and the CH stretch (2942 cm-1). Fourier transformation of the time
dependent sideband lineshapes results in the 2D-Raman spectrum (Figure 2). The signal can be generated by two
alternative mechanisms: a fifth-order Raman process that would directly probe
anharmonic coupling between the two modes, or a third-order cascade in which a
third-order coherent Raman process produces a field that goes on to participate
in a third-order stimulated Raman transition. In our first two papers on the subject (Wilson, 2009;
Mehlenbacher, 2009), we showed that the third-order cascade dominates the
2D-FSRS spectra of acetonitrile and chloroform. This was determined by comparison of the experimental signal
with the predicted magnitude of the third-order and fifth-order signals, the 2D
spectrum of a mixed isotope experiment and the concentration dependence of the
signal.
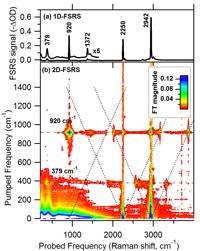
Figure 2. The
one-dimensional (a) and two-dimensional (b) FSRS spectrum of acetonitrile. Part
(a) highlights the frequencies and relative intensities of the various
fundamental Raman transitions in acetonitrile. In (b), sideband peaks are shifted left or right from the
fundamentals by an amount equal to the frequency of the driven mode. Thus, the peak at (1869 cm-1,
379 cm-1) corresponds to the CN bend (dCCN)
frequency subtracted from the CN stretch (nCN) frequency. Peaks along the horizontal dashed lines
all are due to sidebands from the same impulsively driven mode. Diagonal dotted lines connect all
sidebands to an individual high-frequency mode. An
important implication from our newly developed theory was the realization that
the third-order cascade signal was proportional to the square of the analyte
concentration but the 5th-order signal, that carries information
about anharmonic coupling, is proportional to simply the concentration of the
analyte. Hence one technique for revealing the underlying 5th-order
signal would be to dilute the sample by a factor of 10, thereby decreasing the
signal of interest by a factor of 10 but the cascade by a factor of 100. However, with our previous detection
system, the signal-to-noise ratio (SNR) was only about 3, so a ten-fold
dilution would render the signal undetectable. In the spring of 2010, a new detector was purchased with PRF
funds that would allow the detection of much smaller Raman signals. Figure 3 shows a 1D-FSRS spectrum that
highlights the improved SNR of the new detector.
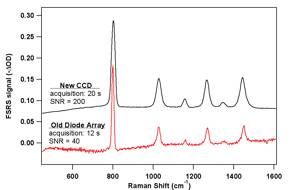
Figure 3.
Comparison of the FSRS spectrum of cyclohexane using the previous diode
array detector (red) or the new CCD (black) that was purchased with PRF
funds. The new detector will
facilitate new experimental methodologies to measure anharmonic coupling of
dilute analytes. After incorporating this new detector
into our laser apparatus, we are ready to begin a new round of experiments in
which we investigate anharmonic coupling in dilute solutions. Additionally, we have performed
calculations to determine the ideal phase-matching geometry of the focused
laser beams in order to inhibit the cascade signal and reveal the underlying
anharmonic coupling signal. These
experiments will begin in October 2010 and continue through 2011 with the
financial support of the ACS PRF.