Reports: DNI656734-DNI6: Intermolecular Interactions in Asphaltene Aggregation: Terahertz Spectroscopic Study of Model Asphaltene Compounds
 printer friendly
The goal of our project is to use THz spectroscopy to study intermolecular interactions and aggregation processes of two model asphaltene compounds, violanthrone-78 (VO-78) and violanthrone-79 (VO-79), which have the same aromatic core but differ in structure and length of aliphatic side chains, using terahertz (THz) time-domain spectroscopy (THz-TDS), optical spectroscopy (UV-VIS), fluorescence spectroscopy and calorimetry.
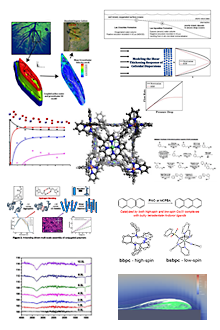
As the first step in our investigation, we have focused on identifying the critical concentration of VO-79 (Fig. 1) in solvents such as toluene, heptane and chloroform using room temperature UV-VIS absorption spectroscopy. VO-79 was purchased from TCI Chemicals. Aggregation of VO-79 and other violanthrone derivatives is thought to occur due to π-π stacking. Delocalization of π electrons throughout the complex in aggregated molecules results in changes in electron levels, and corresponding shifts in UV-VIS absorption and emission spectra. There are, however, outstanding questions about the nature of VO-79 aggregates in different solvents: while some reports suggest J-aggregates, others suggest H-aggregates.1,2
Figure 1. Violanthrone-79 molecule.
Example of UV-VIS absorbance spectra of VO-79 of two different concentrations (0.1 mM and 1.5 mM) are shown in Fig. 2. UV-VIS absorption spectroscopy measurements were carried out at room temperature on a Thermo Electron spectrophotometer. Solutions of different concentration were placed into liquid cells of 1 mm path length. Spectra were baseline corrected using OriginPro software. Spectra in 1.45 eV (~ 850 nm) – 3.5 eV (350 nm) contain multiple absorption bands, and can be fitted with six Gaussian peaks. While high energy (>2.5 eV, or < 450 nm) absorption increases with concentration, it does not exhibit any shape changes. On the contrary, absorption spectrum in the red exhibits a clear blue shift with increasing concentration suggestive of formation of H-aggregates.
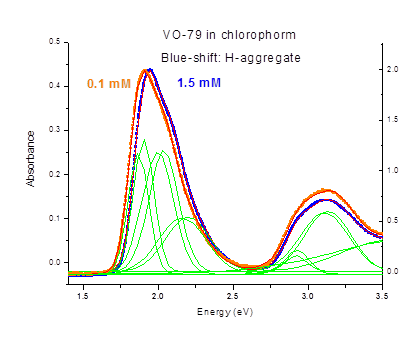
Figure 2. UV-Visible absorption spectra (symbols) of VO-79 in chloroform with concentrations of 0.1 mM (orange, left scale) and 1.5 mM (blue, right scale). Red lines show fits of the experimental data to six Gaussian peaks (shown in green).
To quantify blue shift and establish a critical concentration for VO-79 aggregation, we have tracked central energies of two lowest energy peaks in UV-VIS absorption spectra, as shown in Fig. 3
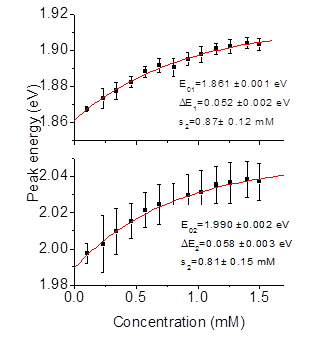
Figure 3. Peak energy of two lowest energy absorption peaks in Fig 2 as a function of concentration. Symbols show peak position as determined from a multi-Gaussian fit to UV-VIS data, and solid curves are fits of data to Eq. 1. Insets show resulting fitting parameters.
We fit the peak positions as a function of VO-79 concentration to an exponential function
![]() . (Eq.1)
. (Eq.1)
Here, E0 is an extrapolation of the peak to vanishingly small concentration (isolated monomers), ΔE is a maximal extrapolated blue shift, and parameter s is a measure of critical concentration. We find that both lower energy peaks shift by as much as > 50 meV when concentration is increased ten-fold. We also establish that the critical concentration, beyond which blue shift of absorption saturates, indicating significant aggregation, is ~ 0.5-0.6 mM. This result pinpoints critical concentration of VO-79 in chloroform with a better accuracy than previously reported 0.1 – 1.0 mM concentration range.1
We are currently performing UV-VIS absorption and fluorescence measurements aimed at establishing whether aggregation can be accelerated or reversed by adding a small amount of a different solvent such as heptane. Characterization of critical aggregation concentrations of VO-79 in various solvents is necessary for interpreting THZ-TDS spectra in the future.
![]()
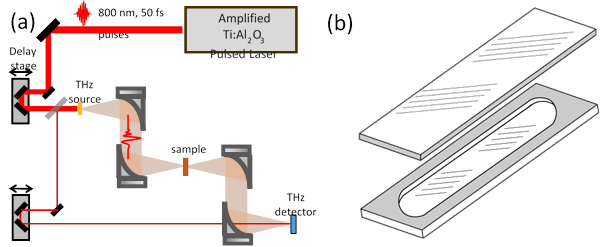 Concurrently, we have adapted out THz-TDS spectroscopy setup3,4 (Fig. 3) that was designed for solid crystalline samples to accommodate liquid samples in demountable fixed volume and flow cells. The schematic diagram of the setup is shown in Fig. 4 (a). Fig. 4(b) shows demountable infrared quartz cells with path length ranging from 100 µm to 500 µm that we are now testing for use in THz TDS solution. These cells do not require a compressable O-ring to seal, and therefore minimize uncertainty in the optical path length that can have detrimental effect on THz measurements.
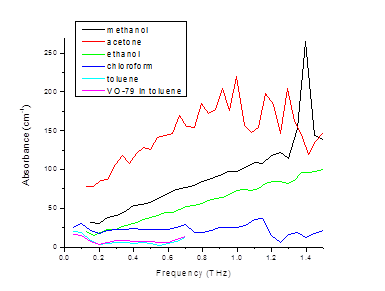
Figure 5. Preliminary data on THz absorbance of various organic solvents.
We have taken preliminary THz TDS data on various solvents such as toluene, ethanol,
aceton, methanol and chloroform, as shown in Fig. 5. We are presently working on optimizing the experimental apparatus for measurements of liquids and improving signal/noise ration in our THz absorption and refractive index spectra. We have also taken preliminary measurements on VO-79 solutions with concentration below aggregation. Once this data is available, we will use an effective medium approach to model complex THz dielectric functions.
We are also presently carrying out steady-state fluorescence measurement on VO-79 in chloroform and chloroform/heptane solutions, and will correlate the resulting data with the UV-VIS absorption in order to confirm measured critical concentration. Our next step will be setting up transient fluorescence measurements which will provide insight into dynamics of aggregates that can be correlated with THz TDS spectra. In addition, calorimetry measurements performed with the help of our collaborators’s (Dr. Iannacchione) group at WPI in order to gain additional insight into aggregation of VO-79 and related model asphaltene compounds.
(1) Cyran, J. D.; Krummel, A. T. Probing structural features of self-assembled violanthrone-79 using two dimensional infrared spectroscopy. The Journal of Chemical Physics 2015, 142, 212435.
(2) Shi, M.-M.; Chen, Y.; Nan, Y.-X.; Ling, J.; Zuo, L.-J.; Qiu, W.-M.; Wang, M.; Chen, H.-Z. π−π Interaction among Violanthrone Molecules: Observation, Enhancement, and Resulting Charge Transport Properties. The Journal of Physical Chemistry B 2011, 115, 618-623.
(3) Schmuttenmaer, C. A. Exploring dynamics in the far-infrared with terahertz spectroscopy. Chem. Rev. 2004, 104, 1759-1780.
(4) Jepsen, P. U.; Cooke, D. G.; Koch, M. Terahertz spectroscopy and imaging–Modern techniques and applications. Laser & Photonics Reviews 2011, 5, 124-166.