AmericanChemicalSociety.com
Reports: AC8 48115-AC8: Quantifying the Links between Geophysical and Geochemical Properties of Organic-Rich Shales
Organic-rich shales are intrinsically complex heterogeneous rocks comprising inorganic framework in which organic matter may be dispersed in different amounts. Geochemical characterization of kerogen dispersed in organic-rich shales was extensively used (Teichmüller, 1986) to quantitatively discriminate the type and maturity of kerogen-constituting macerals. However, we still lack fundamental relationships relating the maturity of organic fraction and rock-physics properties used to support seismic exploration.
During second year of project, we addressed the problem of understanding elastic properties of organic matter in source rocks so that better prediction of seismic velocity can be made. Conventional measurements of ‘macroscopic' or ‘average' properties on core plugs are not sufficient to fully address the degree of property variation within organic-rich rocks. We estimate the Young's, Shear and Bulk moduli of a source rock sample from Bazhenov Formation using nanoindentation technique and map elastic property difference in the sample from Bakken Formation through application of atomic-force microscopy (AFM). Our approach for elastic property estimation and mapping is based on coupling of methods that are able to visualize and identify organic matter within the rock and then measure its nanoscale elastic properties. We thus coupled nanoindentation and AFM methods with scanning electron microscopy (SEM) and confocal laser-scanning microscopy (CLSM). We perform nanoindentaion experiments on areas previously identified as kerogen via SEM and CLSM, and subsequently calculating Young's modulus from force-displacement curves obtained while probing. We performed a series of nanoindentation experiments targeting primarily organic matter (reported in this study), siliceous dolomite, quartz and pyrite minerals. The workflow (Figure 1) for identifying the area of interest is as follows:
1. Identifying possible area of interest (organic-rich) using SEM images.
2. Confirming presence of organic matter via CLSM images.
3. Performing nanoindentation measurements and AFM mapping within areas of interest.
4. Identifying indentation marks on sample surface by SEM (needed to verify that kerogen was indented in previously targeted area).
5. Computing elastic properties (Young's, Bulk and Shear moduli) of organic matter, as well as mineral matrix.
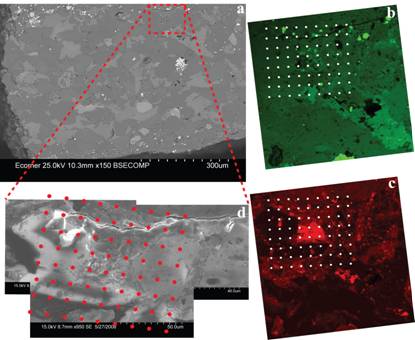
Figure 1: Workflow for identifying area of interest. a) low magnification SEM image of Bazhenov Formation sample; all following images are of area of interest marked by dashed red box. b) CLSM image of area of interest using 488nm wavelength excitation. c) CLSM image of area of interest using 543nm wavelength excitation. d) High-magnification SEM mosaic of Bakken Formation area of interest; indentation points are marked by red dots. Sampling area denoted by white and red dots in Figure 2b and c and 2d respectively is 120×110 μm.
Figure 2 shows the map of Young's modulus quantified from nanoindentation experiments targeting organic matter. Young's Modulus is computed by assuming a Poisson's ratio of 0.25. A Poisson's ratio of 0.07 was assigned to the surrounding mineral matrix, which corresponds to pure quartz. Here, organic-rich portions of the sample are characterized by relatively low values of Young's modulus ranging from 10 GPa to 15 GPa. In contrast, areas of sample not emitting bright fluorescence (Figures 1b and 1c) correspond to the mineral matrix (predominantly quartz with some pyrite) which is characterized by higher values of Young's modulus in excess of 60 GPa.
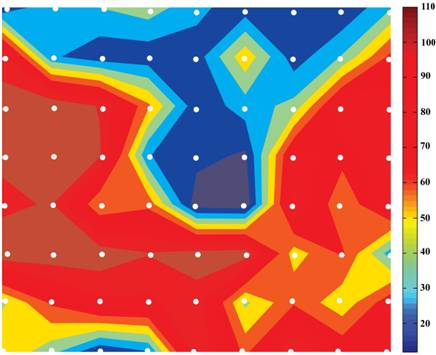
Figure 2. Young's modulus map of area of interest. Organic matter (dark blue) is characterized by low (10-15 GPa) values of Young's modulus. Bar on right is in GPa. Sampling area is 120×110 μm.
Bulk modulus (K) values were computed using:
 (3)
(3)
Figure 3 shows map of the bulk modulus for the analyzed sample. The organic-rich portion is characterized by values of bulk modulus ranging between 5 GPa and 10 GPa, whereas areas of sample corresponding to mineral matrix are characterized by bulk modulus values higher than 20 GPa.
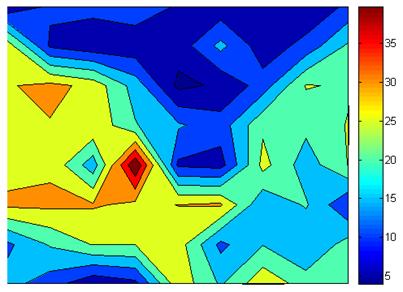
Figure 3. Bulk modulus map of area of interest. Organic matter (dark blue) is characterized by low (5-10 GPa) values of bulk modulus. Bar on right is in GPa. Sampling area is 120×110 μm.
Shear modulus (μ) values were computed using:
Figure 4 shows map of the shear modulus for the analyzed sample. Organic-rich part of the sample is characterized by shear modulus values of up to 5 GPa, whereas areas of sample corresponding to the mineral matrix are higher than 30 GPa.
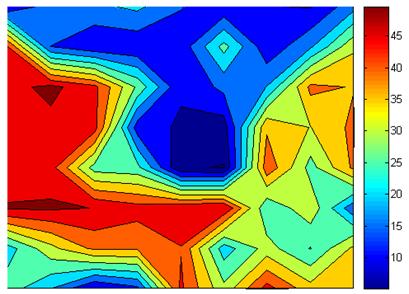
Figure 4. Shear modulus map of area of interest. Organic matter (dark blue) is characterized by low (4-5 GPa) values of shear modulus. Bar on right is in GPa. Sampling area is 120×110 μm.
Table 1 provides a comparison of elastic properties of kerogen obtained in this study to both the nanoindentation measurements by Zeszotarski et al. (2004) and data from inversion of ultrasonic measurements (Vernik et al., 1994). For corresponding values of Poisson's ratio, the two nanoindentation methods (this study and Zeszotarski et al. 2004) show good agreement.
Table 1. Comparison of elastic properties of organic matter obtained in this study with elastic properties reported in literature by using nanoindentation measurements (Zeszotarski et al., 2004) and inversion from ultrasonic data (Vernik et al., 1994).
Method: nanoindentation – this study
| |||
ν | E (GPa) | K (GPa) | μ (GPa) |
0.07 | 13 | 4.6 | 5.6 |
0.25 | 11.9 | 8 | 4.8 |
0.35 | 11 | 13.3 | 4.4 |
0.45 | 10.1 | 39.8 | 4.1 |
Method: nanoindentation - Zeszotarski et al., 2004
| |||
0.07 | 10.5 | 4.1 | 4.9 |
0.25 | 10 | 6.7 | 4 |
0.35 | 9 | 10 | 3.3 |
0.45 | 8 | 26.7 | 2.8 |
Method: inversion from ultrasonic data -Vernik et al., 1994
| |||
n/a | n/a | 6.8 | 3.6 |
This study shows a combined application of SEM, CLSM imaging and nanoindentation characterization, which provides microscopic basis to analyze these macroscopically complex and heterogeneous rock samples. Organic matter was successfully imaged within the matrix of Bazhenov Formation despite inherent lithologic differences of the phases. Nanoindentation measurements showed kerogen within Bazhenov Formation to be softer than surrounding mineral matrix. In particular, Young's modulus of kerogen from Bazhenov Formation varies between 10 and 15 GPa, whereas bulk and shear moduli vary from 5 to 10 GPa and from 4 to 5 GPa, respectively. At different Poisson's ratios, corresponding elastic properties measured and computed in this study and by others are in good agreement.
