AmericanChemicalSociety.com
Reports: ND6 48876-ND6: Frequency-Based Optical Spectroscopy
We have constructed a new spectrometer based on a femtosecond frequency comb-referenced external cavity diode laser that permits the measurement of molecular spectra with an accuracy and precision approaching 1 part in 1012. Major capital components were purchased from other funds but the PRF provides all operating funds and support for a graduate student. The current optical stability is at the level of Allen variances of between 10 and 30 Hz of the external cavity diode laser, used for the spectroscopic source, relative to the comb frequency standard and limited by vibrational and acoustical noise in the building. Figure 1 shows the first absorption line measurement achieved in the laboratory during the late summer of 2009.
| Figure 1: Doppler broadened P(11) line in the v1+v3 band of acetylene at 195739.6 GHz recorded using an extended cavity diode laser referenced to a frequency comb. |
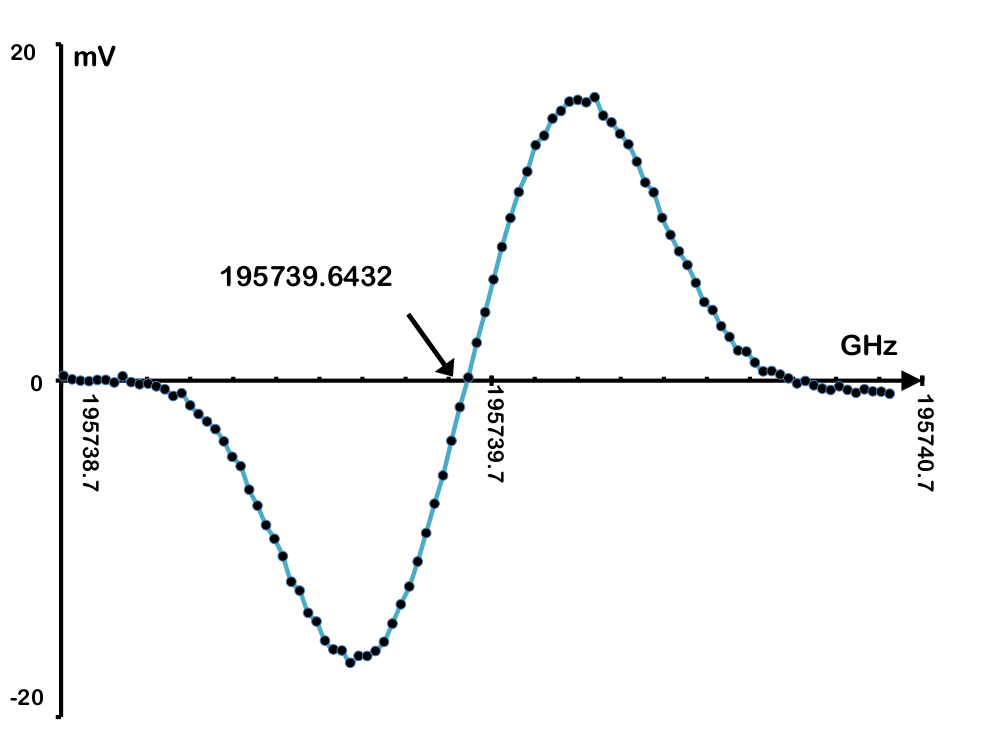
This is a Doppler broadened absorption line in the v1 + v3 combination band of acetylene (C2H2) in a low pressure (few tens of mTorr) sample at ambient temperature recorded by frequency modulating the diode laser beam at 194 MHz using an electro-optic modulator and heterodyne detection, resulting in a derivative line shape.
In order to characterize the absolute precision attainable, the instrument was modified to permit sub-Doppler saturation dip measurements. This proved quite challenging given the modest powers attainable using low powered diode laser sources since the optical pumping rate is generally lower than collisional dephasing rate in samples at pressures of more than a few mTorr pressure. A resonant cavity-based absorption cell was designed and constructed using a confocal mirror design. In order to scan across the line, the cavity is locked to the laser frequency which was itself offset-locked to the frequency comb. Cavity locking was achieved using the Pound-Drever-Hall scheme, which avoids the need to modulate the laser frequency to provide the error signal.
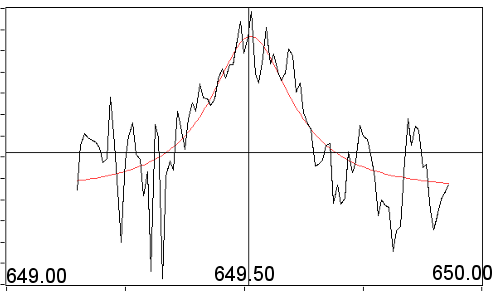
Figure 2 shows the measurement of the sub-Doppler, saturation dip, feature for the same line as shown in figure 1, recorded in a 1 meter long confocal cavity and a pressure of 5 mTorr of C2H2 at ambient temperature. Saturation dip sub-Doppler spectra of lines in this band of C2H2 have previously been measured and used as secondary frequency standards. Our measured frequency of 195,739.649 513 5 (80) GHz is within the error limits of published measurements, hence confirming the stability and accuracy of the new system. The 8 kHz error corresponds to 2.5 parts in 1012.
Frequency - 195,739,000.00 MHz | Figure 2: Saturation dip measurement of the line center of the line shown in figure 1 with Lorentzian fit (red). The line center is 195,739.649 513 5 (80) GHz. |
These are not simple measurements. The laser power (2-3mW) is marginal for saturation spectroscopy, and scanning over more than one free spectral range of the cavity(approx 150 MHz) is challenging given the available piezo-electric cavity end mirror mount.
The sub-Doppler measurement was finally achieved during early spring 2010, less than one year from beginning the construction of the spectrometer. Construction of a more stable cavity absorption cell is underway, and this can be optionally used in either a cavity mode or, by replacing the mirrors, as a Herriott or White-type multipass absorption cell. This cell will be employed for measurements of substituted acetylenes as in the original proposal. However, a discussion with Professor Arlan Mantz (Connecticut College) at the Columbus Spectroscopy Symposium in June of this year led to a very productive detour in the planned research and this is described below.
The comb-referenced spectrometer developed here is ideally suited to making line shape measurements for calibration of astronomical observations as well as for fundamental molecular physics.
| Figure 3: Measurements of P(11) of the 1.5 micron acetylene band as a function of added nitrogen gas at a temperature of 144K. |
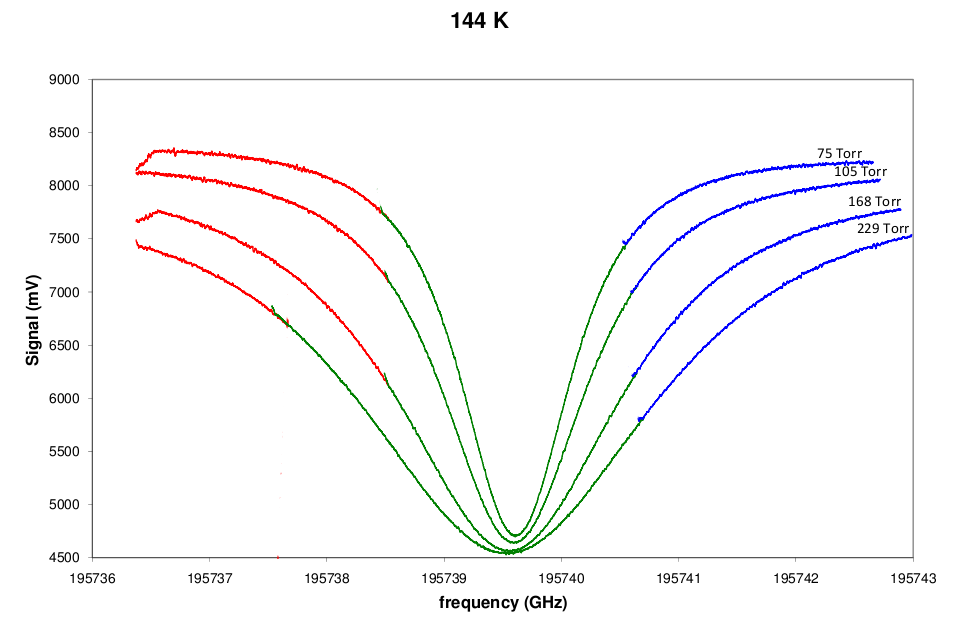
Figure 3 shows an example of a series of measurements at 144 K of the same rotational line in the acetylene 1.5 micron spectrum with pressures of nitrogen collision gas between 75 and 229 Torr. Measurements have been made at temperatures between 296 and 115K for nitrogen pressures of up to one atmosphere; the acetylene pressure is between 100 mTorr and 10's of Torr. The spectra were obtained by stitching together 3 successive scans with the laser locked to 3 different comb lines. Each colored section is typically 2.4 GHz. Not only is the pressure broadened width changing, but the pressure shift is clearly evident. This effect has traditionally been extremely difficult to quantify. We will make measurements in a shorter, 1 cm long, cell to characterize the self-broadening in acetylene in the higher pressure samples.
Table I shows some preliminary broadening and shift parameters determined from fitting some of the data to a Rautian (hard collision) model.
Table I. Preliminary results from fitting line shape data for 296 and 176 K
Temperature (K) | γ (cm-1/atm) (pressure broadening) | β (cm-1/atm) (Dicke narrowing) | Π(cm-1/atm) (pressure shift) |
296 | 0.08704(19) | 0.0284(5) | -0.00805(6) |
176 | 0.12496(15) | 0.0294(7) | -0.01253(3) |
It shows the large variation in line broadening parameters as a function of temperature. Measurements at low temperatures are crucial for accurate interpretation of, for example, recent spectroscopic observations of the atmosphere of Titan. We are preparing several manuscripts for publication and preliminary results acknowledging PRF support have been reported at several international meetings.
