AmericanChemicalSociety.com
Reports: B6 45728-B6: Structure of Molecular Rydberg States in Supercritical Alkanes
Other participating researchers
Mr. Yevgeniy Lushtak, graduate student, Queens College -- CUNY, New York, NY 11367.
Mr. Charles Payne, undergraduate student, Queens College -- CUNY, New York, NY 11367 and University of Louisiana at Monroe, Monroe, LA 71209.
Dr. Cherice M. Evans, Queens College -- CUNY, New York, NY 11367 and University of Louisiana at Monroe, Monroe, LA 71209.
Introduction
Last year, we investigated the structure of low-n CH3I Rydberg states in supercritical CH4. We showed that low-n CH3I Rydberg states in dense CH4 could be accurately simulated using a fast Fourier transform of a semi-classical line shape function (convoluted with a Gaussian slit function). This semi-classical line shape analysis depended upon the difference between the excited state CH3I/ground state CH4 and the ground state CH3I/CH4 intermolecular potentials, the CH3I/CH4 radial distribution function (RDF) and the CH4/CH4 RDF. The successful line shape simulation allowed a moment analysis to be performed on the simulated primary transition. This moment analysis showed that the CH4 induced energy shift of the primary CH3I 6s (or 6s') transition exhibits a clear critical point effect near the critical density of CH4. This year, we obtained the vacuum ultraviolet absorption spectra of the Xe 6s and the CH3I 6s and 6s' Rydberg states in CF4 on the Seya-Namioka beamline at the University of Wisconsin Synchrotron Radiation Center (NSF DMR-0537588).

Figure 1. (a) the Xe 6s absorption band, (b) the primary CH3I 6s absorption band, and (c) the CH3I 6s + ν2 absorption band perturbed by 1.5 × 10²¹ molecules of CF4/cm3.
As the density of CF4 increases, the Xe 6s band continues to blue broaden, due to collisional de-excitation. Unlike the Xe/atomic perturber systems, Xe does not form ground state Xe/CF4 dimers or Xe*/CF4 excimers. Therefore, the energy shift of this band as a function of CF4 number density could be obtained directly for low to medium densities. Regrettably, the ultrahigh purity CF4 contained a nitrogen impurity, which made it difficult to determine the energy shift of the Xe 6s band at high CF4 number densities. Therefore, we again simulated the Xe absorption band in order to determine the CF4 induced energy shift at high CF4 number densities. In order to determine the CF4 induced energy shift of the CH3I 6s Rydberg state, we simulated both band (b) and band (c), since they merge at medium (i.e., 5.0 × 1021 cm-3) number densities.
Fig. 2 shows a full line shape simulation (blue lines) in comparison to the absorption spectra (black lines) of the Xe 6s Rydberg transitions perturbed by CF4 at noncritical temperatures (a) and on an isotherm near (i.e., + 0.5ºC) the critical isotherm (b). Similar data are shown for the CH3I 6s Rydberg transition in Fig. 3. The simulation uses the fast Fourier transform of
![]()
convoluted with a Gaussian slit function for each of the bands in Fig. 1. Here, A1(t) represents the average two body interactions between the excited state dopant and the ground state CF4 and, therefore, is a function of the ground state dopant/CF4 radial distribution function gDP(r), and of the difference between the excited state dopant/CF4 and ground state dopant/CF4 intermolecular potentials [Ve(r) and Vg(r), respectively]. A2(t) gives the average three body dopant/CF4 interactions. Within the Kirkwood approximation, A2(t) is a function of both gDP(r) and the CF4/CF4 radial distribution function g(r), as well as Ve(r) and Vg(r). b>Thus, these simulations yield a single set of ground state and excited state intermolecular potential parameters for each dopant/CF4 system investigated.
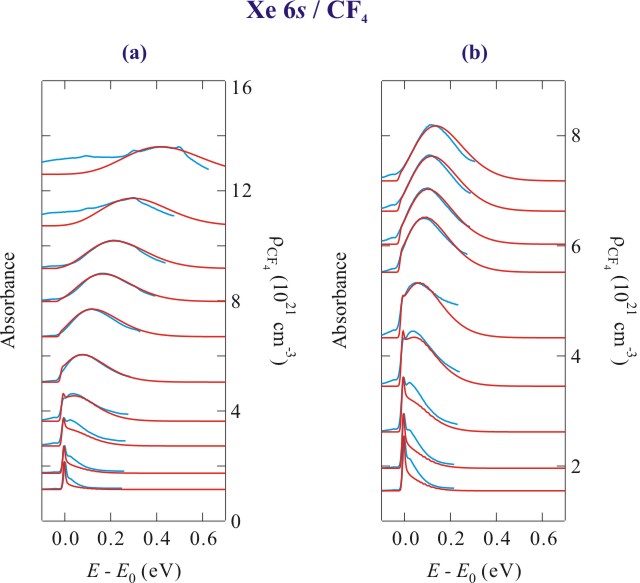
Figure 2. Selected absorption spectra (blue lines) and simulated line shapes (red lines) of the Xe 6s Rydberg state at (a) noncritical temperatures and (b) along an isotherm near the critical isotherm of CF4. The data are offset by the CF4 number density.
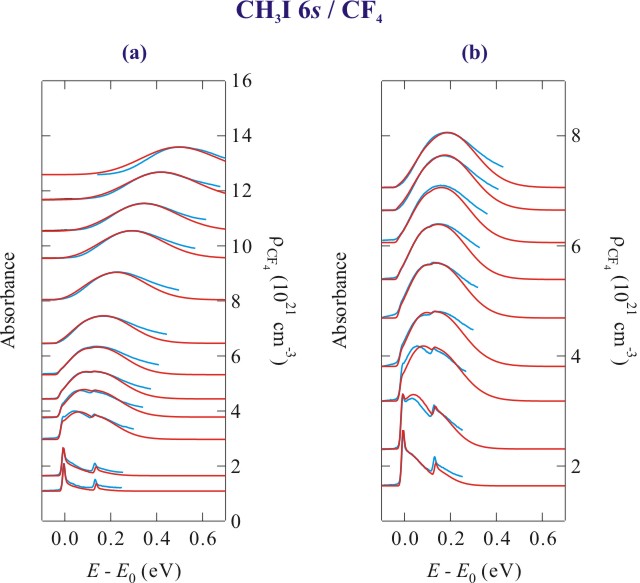
Figure 3. Selected absorption spectra (blue lines) and simulated line shapes (red lines) of the CH3I 6s Rydberg state at (a) noncritical temperatures and (b) along an isotherm near the critical isotherm in CF4. The data are offset by the CF4 number density.
Following the successful line shape simulation, a moment analysis was performed on the primary (or adiabatic) transition to obtain Δ(ρP), which is presented in Fig. 4. Fig. 4 shows a distinct critical point effect on the order of 5 meV for Xe and 15 meV for CH3I, which is smaller than that observed for the rare gases or for CH4. This effect, which results from an increase at the critical point in the local perturber number density [i.e., ρloc = ρP gDP(r)] near a dopant atom, is smaller in CF4 because of the low bulk density (i.e., 4.3 × 1021 cm-3) at the critical point.
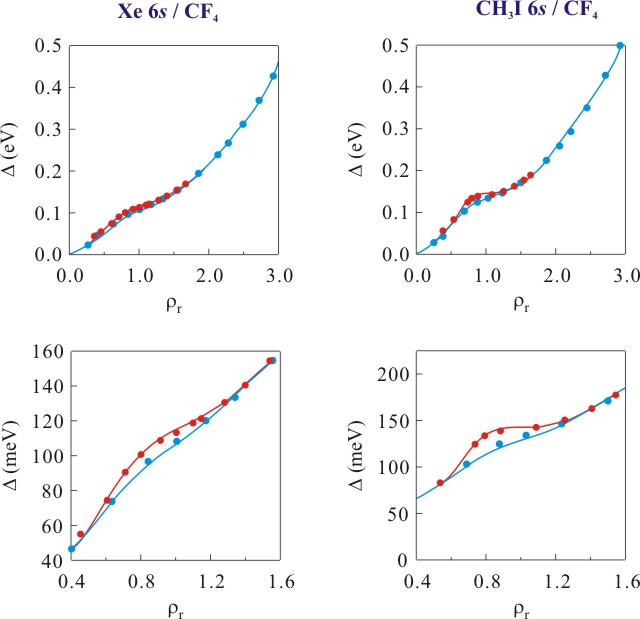
Figure 4. The CF4 induced shift Δ (as approximated by the first moment) of the simulated primary transition for the 6s Rydberg state of (a) Xe and (b) CH3I as a function of reduced number density ρr (where ρr = ρ/ρc with ρc = 4.3 × 1021 cm-3) at (●) noncritical temperatures and (●) near the critical isotherm. Solid lines are visual aids.
Conclusion
We have investigated perturber critical point effects on the 6s and 6s' Rydberg states of Xe and CH3I. We have shown that perturber induced broadening can be successfully simulated using a semi-classical line shape function with a single set of potential parameters for each dopant/perturber system. We were then able to use the simulated absorption bands to extract the perturber-induced energy shift of the band and to demonstrate that this shift is affected by the critical point of the perturber, as shown in Figs. 5 and 6.
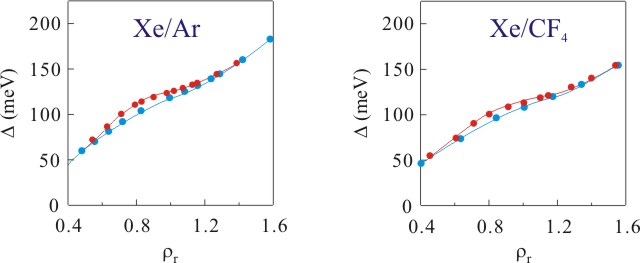
Figure 5. Summary of the perturber critical point effect on the energy shift of the 6s Rydberg state in Xe plotted as a function of reduced number density. (●) noncritical temperatures and (●) near the critical isotherm. Solid lines are visual aids.
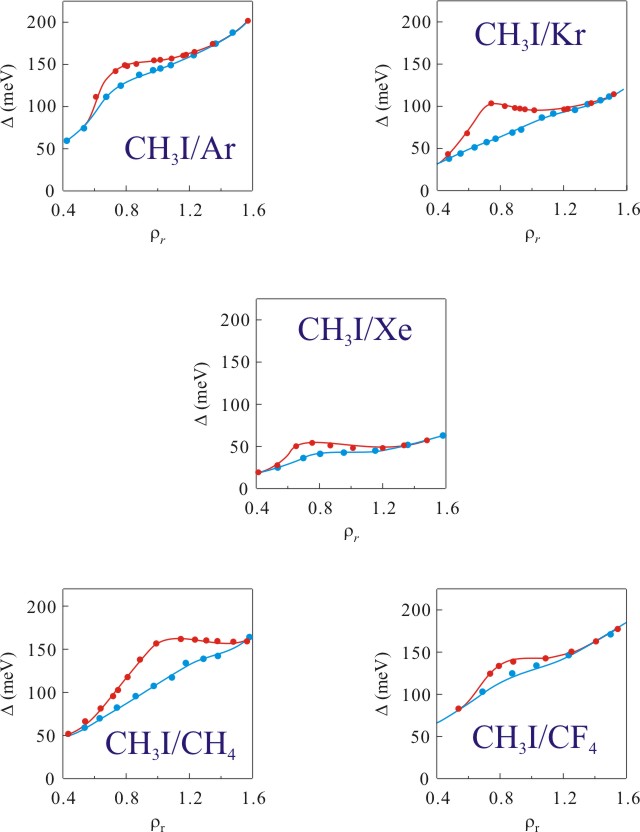
Figure 6. Summary of the perturber critical point effect on the energy shift of the 6s Rydberg state in CH3I plotted as a function of reduced number density. (●) noncritical temperatures and (●) near the critical isotherm. Solid lines are visual aids.
