

45485-AC5
Multi-Scale Simulation Studies of Anhydrous Proton-Conducting Materials for Use in High-Temperature Fuel Cell Applications
Report Narrative
Enhanced sampling of rough energy landscapes via spatial-warping transformations
One of the computational grand challenge problems is the development of methodology
capable of sampling conformational equilibria in systems with rough
energy landscapes. We have introduced a
new approach in which molecular dynamics is combined with
a novel variable transformation designed to warp configuration
space in such a way that barriers are reduced and attractive
basins stretched. The fundamental idea can be illustrated
for a single particle of mass m
moving in a one-dimensional double-well potential V(x)
with minima at  and
a barrier of height
and
a barrier of height  . If
. If
 , then
barrier-crossing in a thermostatted molecular dynamics
calculation will be rare. Now consider the classical canonical partition
function
, then
barrier-crossing in a thermostatted molecular dynamics
calculation will be rare. Now consider the classical canonical partition
function
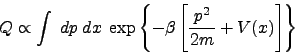 |
(1) |
Considering that the potential
 (
( ) is a ``rough'' function of
  , we change variables to u=f(x)
with the goal of
smoothing out the roughness but without altering any of the
equilibrium properties of the system.
A choice for f(x) that accomplishes this is
, we change variables to u=f(x)
with the goal of
smoothing out the roughness but without altering any of the
equilibrium properties of the system.
A choice for f(x) that accomplishes this is
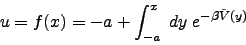 |
(2) |
where
 (
( ) is an arbitrary potential.
Since f(
) is an arbitrary potential.
Since f( ) is monotonically increasing,
the inverse
) is monotonically increasing,
the inverse  =
=  (
( ) exists.
Now the partition function becomes
) exists.
Now the partition function becomes
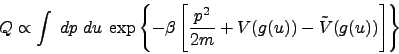 |
(3) |
Since the difference
 (
( (
( ))-
))- (
( (
( )) appears in the
above, the optimal choice for
)) appears in the
above, the optimal choice for
 (
( ) is
) is  (
( ) =
) =  (
( ) for
) for  [
[ ,
, ] and
] and
 (
( ) = 0 for |
 |
| . With this choice, the
difference potential
. With this choice, the
difference potential  -
- will have no barrier.
Thus, by performing thermostatted molecular dynamics
with the Hamiltonian
will have no barrier.
Thus, by performing thermostatted molecular dynamics
with the Hamiltonian
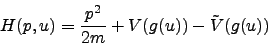 |
(4) |
sampling efficiency can be significantly enhanced. The new scheme is denoted REPSWA for REference Potential Spatial Warping Algorithm.
The performance of the method is demonstrated on a long polymer chain and is shown to outperform replica-exchange Monte Carlo with only one trajectory. To implement REPSWA to polymers and biomolecules, the transformations are applied to the backbone dihedral angles, which are useful for determining the conformational space of the molecule. The comparison between REPSWA, hybrid Monte Carlo and parallel tempering for an all-atom 50-mer alkane chain is shown in Fig. 1 below.
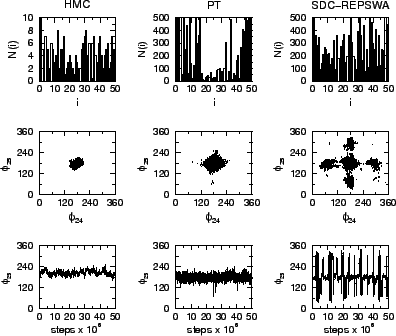
Figure 1: Comparison between HMC, PT with 10 replicas, and REPSWA in their sampling efficiency for a 50-mer alkane chain. Top: N(i), number of barrier crossing events for each dihedral i from a 50-million MC step trajectory. Middle: Ramachandran plot of the central dihedral angles (24 and 25). Bottom: Value of the central dihedral (25) as a function of MC steps.
The figure shows, with one trajectory, REPSWA is able to visit more minima than either hybrid Monte Carlo or parallel tempering.
Development and testing of force field parameters for imidazole attached to a polymeric spacer
Earlier, we reported
a set of force field parameters for the
attachment of imidazole to a polyethyleneoxide spacer, as discussed
in the original proposal.
We have now tested this force field on the experimental crystal
structure of the material in order to ensure that the force
field parameters are able to maintain the crystal structure.
Fig. 2 shows a snapshot of the experimental
crystal structure, which was the starting structure for a
molecular dynamics calculation of a system containing
32 molecules (2 4
4 4 unit cells) at a temperature of 120 K.
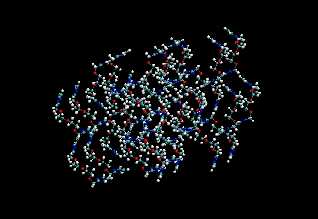
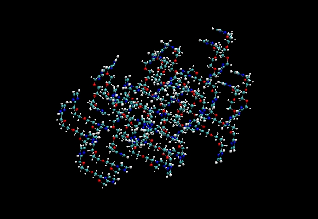
Figure 2: (Left) Snapshot of the initial crystal structure (Right) Snapshot from a simulation at 120 K after 13 ps.
The figure also shows the final structure from the end of a 13 ps run in the NVT ensemble. We see that the crystal structure is well maintained. Fig. 3 shows the NH radial distribution function computed from this molecular dynamics trajectory together with that calculated from the original crystal structure. It can be seen that the peaks line up reasonably well, indicating that our force field is a sufficiently accurate one. The first peak in the NH distribution of the crystal structure is due to partially transferred protons not treated by the force field.
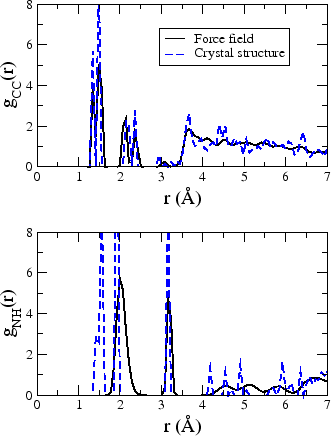
Figure 3: Carbon-carbon (top) and nitrogen-hydrogen (bottom) radial distribution functions from the simulation (solid black) and crystal structure (dashed blue).
A transformation-free approach to free-energy calculations
Recently, we introduced the
Adiabatic Free Energy Dynamics (AFED) method
for computing free
energy profiles quickly and accurately using a dynamical adiabatic
separation between a set of collective variables or reaction
coordinates and the remaining degrees of freedom of a system.
This approach leads
to a significant gain in efficiency versus traditional
methods and is able to generate
multidimensional free-energy surfaces efficiently.
However, the need for coordinate transformations is a
significant drawback.
We have now extended this approach to circumvent
these via the introduction of a set of extended phase-space
variables, to which the adiabatic coupling and high-temperature
are applied. The figure below shows how a full
free energy surface in the radius of gyration,  ,
and number of hydrogen bonds,
,
and number of hydrogen bonds,  evolves (see Fig. 4 for illustration).
The surface is converged in 5 ns.
evolves (see Fig. 4 for illustration).
The surface is converged in 5 ns.
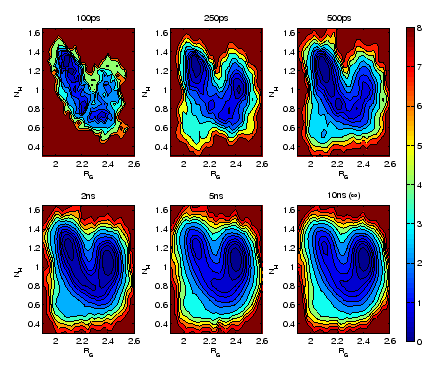
Figure 4:
Time evolution
of the free-energy
 (
( ,
, ) for
N-acetyl-tryptophan-methylamide (NATMA) in the gas phase with
the CHARMM22 force field.
) for
N-acetyl-tryptophan-methylamide (NATMA) in the gas phase with
the CHARMM22 force field.