47193-B9
Simulation and Experimental Investigation of Energy Losses in Dividing Flow
Introduction
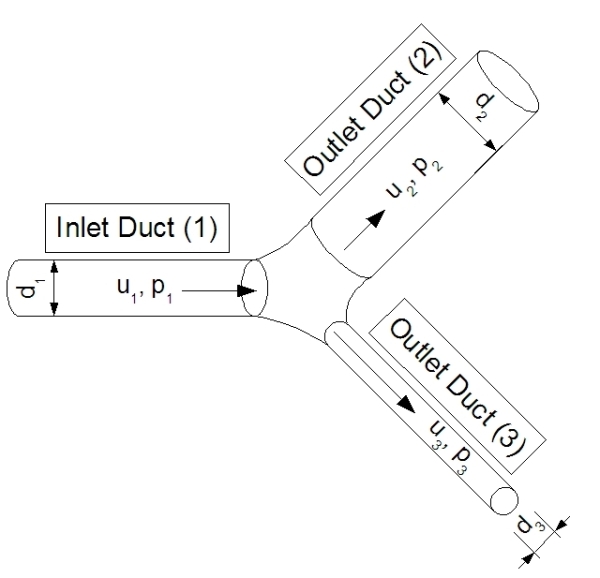
This ACS-PRF grant will establish flow loss coefficients for laminar (Reynolds number of less than 2000) dividing flow for arbitrary geometries as shown in Fig. 1. The inlet/outlet diameters and angles for these dividing flow junctions (junctions) vary so that coefficients may be used in flow simulations of random pore networks. The PI performed simulations of microscale, laminar, 2D flow in Fig. 1 junctions using computational fluid dynamics (CFD) software. These simulations are being extended to 3D planar and nonplanar junctions. Simulations are being validated by constructing scaled-up versions of a subset of simulated junctions -- allowing direct measurement of the loss coefficients.
Figure 1: Dividing flow (junction) geometry.
Sept.
2007 -- Dec. 2007
Simulations
An algorithm was developed to create 3D planar junctions. This initial attempt involved the use of "complex hull" theory to create these geometries. Difficulties with implementation of this algorithm lead to seeking other solutions in Spring 2008.
Experimental
A team of three students began work on the experimental side of this project in Fall 2007. One of these students was paid a stipend by the grant, while all three students were satisfying their senior capstone design requirement. Supplies for the construction of the system were purchased and initial design and construction was begun.
Jan. 1, 2008 -- May 15, 2008
Simulations
A successful algorithm to generate 3D planar junctions was created. This technique creates a skin surface for the junction made up of a number of splines. This algorithm was implemented with a combination of code and geometry creation software, GAMBIT allowing for automation of the process to create junctions with varying diameters and angles. Figure 2 shows a sample geometry.
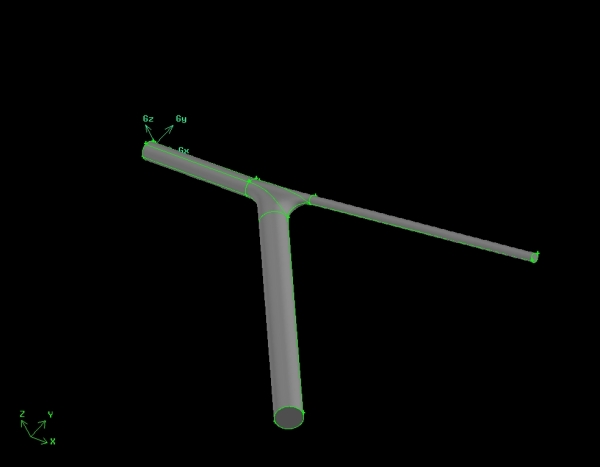
Figure 2: Junction simulated in Spring 2008 semester.
Flow
simulation was performed using FLUENT CFD software. Fig. 3 shows
velocity vectors entering and leaving a junction. Fig. 4 shows
streamlines with large flow fraction in the upper branch causing a
large loss coefficient due to streamline bending. The 3D results
were 1.5 times larger than the 2D planar results due to the increased
pressure losses and increased kinetic energy gains in 3D junctions.
The results were presented in the form of a conference paper.
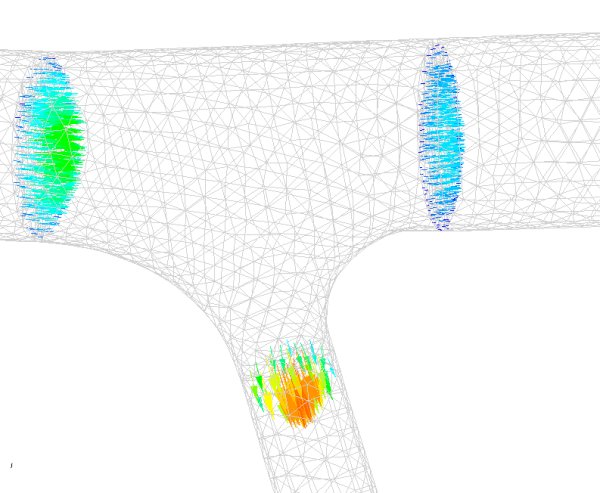
Figure 3: Fluid velocity vectors entering and leaving a junctions.
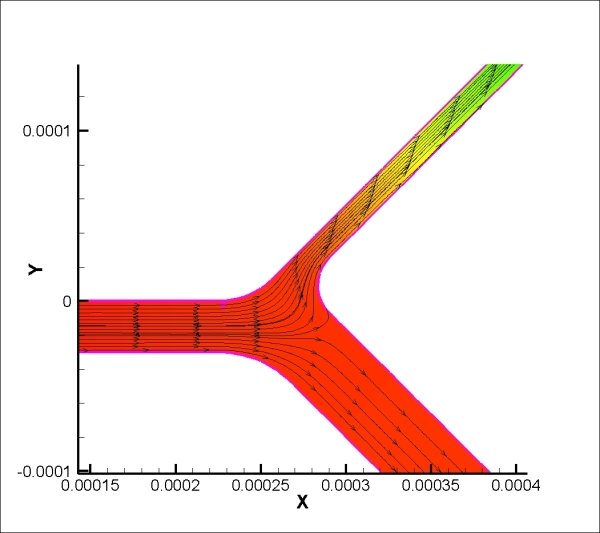
Figure 4: Streamlines for f2 = 0.7, θ2=65°, θ3=45°, d2/d1=0.5, d3/d1=1.5.
Experimental
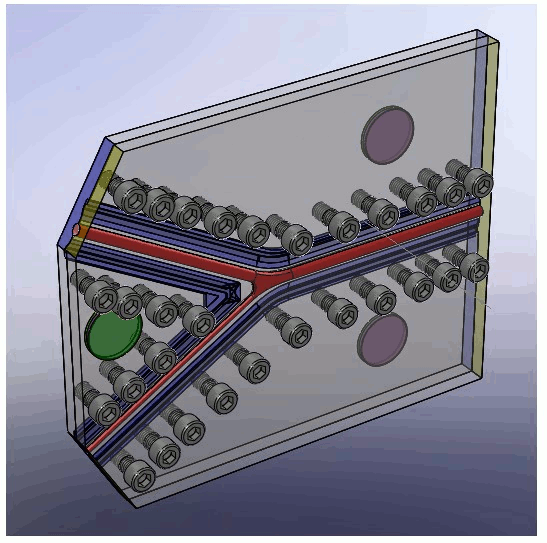
The experimental design team built the system shown in Fig. 5. A close-up of a junction with pressure taps is shown in Fig. 6. A pump provides flow from a large tank to an upper tank feeding a constant head tank through control valves. The fluid exits the tank through a long entrance tube to the junction which contains pressure taps connected to pressure sensors.
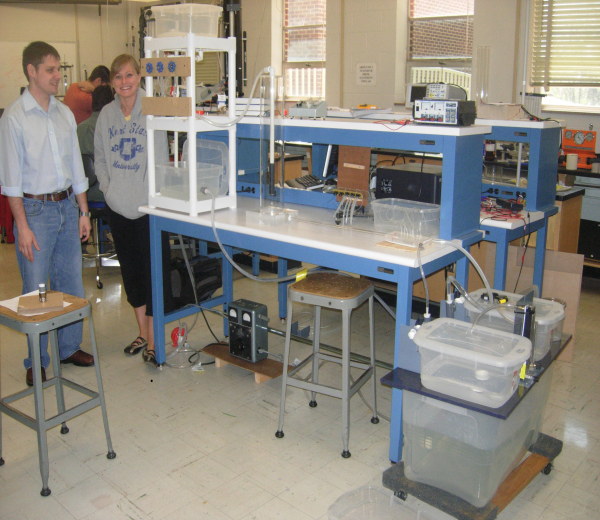
Figure 5: Experimental Flow system constructed in Spring 2008.
Pressure
sensors were calibrated and measurements were made at Reynolds
numbers between 1000 -- 2000 numbers. Comparison of pressure losses
through a junction with simulation results was not successful at this
time due to calibration and connection of sensors.
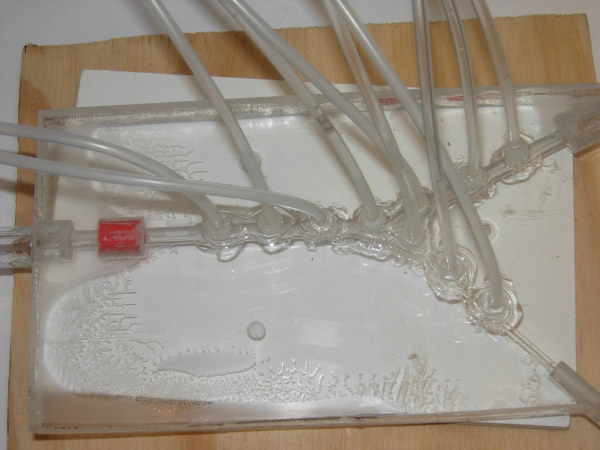
Figure 6: Close up of junction with pressure taps in Spring 2008.
May
16, 2008 -- Aug. 31, 2008
Simulations
A new geometry algorithm was developed during this time period that creates smooth, continuous curvature junctions (as shown in Fig. 7). This new procedure is fully automated with no failed geometries to date. CFD simulation was performed for subset of geometries in the Summer 2008 and loss coefficients were similar to the simulations from Spring 2008.
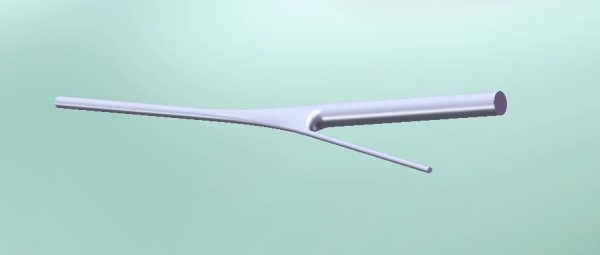
Figure 7: Junction created from new algorithm created in Summer 2008.
A
mesh study was performed for inlet/exit tubes, and an automated
procedure was developed to generate, simulate, and analyze results.
Tube meshing resolution tests were completed and additional junction
mesh refinement is now underway.
Experimental
Two new students took over the experimental side of the project with one working on pressure sensor electronics and one on automation of the milling process for junctions and on validating pressure measurements with a manometer. The approach with pressure measurement was revamped with a new data acquisition system, noise reduction, and a code to read, display, and capture data. Fig. 8 shows acquisition of pressure data with the code. Improvements were made in terms of production of junctions. A manometer bank was built to measure pressure drops, which was successful, but did not meet resolution requirements. The new electronic system is working well and is currently being tested and calibrated for use in a comprehensive set of pressure measurements for junctions in Fall 2008.
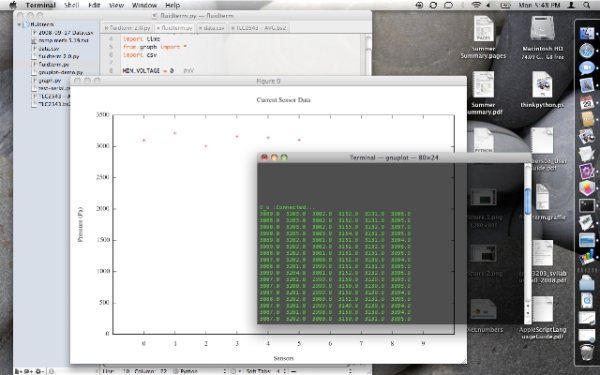
Figure 8: Screenshot of current pressure measurement system as data is acquired. Note the graph entitled "Current Sensor Data" displays real-time pressures from a junction.
Additional
improvements have recently been made on the construction of the
junction test sections as shown in Fig. 9. Creation of a zone for silicone gaskets to prevent leakage and not
allow interference of adhesives with the flow passages should improve
performance compared to previous junctions.