46752-AC7
Kinetic Control of Epoxy Morphology and Its Effect on Moisture Diffusion
Epoxy resins are a versatile class of thermosetting polymer which is extensively used as composite matrix and structural adhesive. It has been shown that the microstructure of cured epoxy resin consists of a highly crosslinked region (“hard phase”) embedded in a matrix of a lower crosslink density region (“soft phase”). This soft and hard phase morphology has been shown to vary with stoichiometry in an EPON 828 epoxy cured with PACM 20 amine.1 The flexural storage modulus, glass transition temperature and fracture toughness change with stoichiometry in a way that can be correlated with the changes in morphology. In addition, the soft and hard phase morphology as well as the physical properties of the cured epoxy matrix is affected by bimodal-type molecular weight distributions of epoxy oligomers.2 While these and other studies show that properties change with morphology, there is currently no understanding of how to control the morphology. We believe the hard and soft phase morphology could be controlled kinetically by the balance of the rate of curing reaction(chain growth) and rate of nucleation and growth process (chain diffusion).
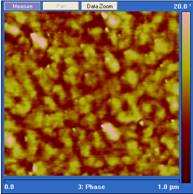
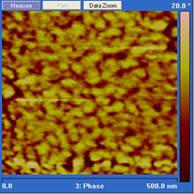
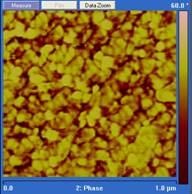
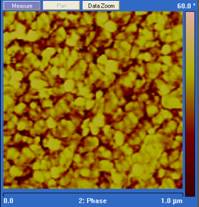
Curing temperature is a major parameter that controls both the rate of chain growth and the rate of chain diffusion during cure. In our experiments, diglycidylether of bisphenol A (DGEBA) was cured with Jeffamine D230 at 25˚, 90˚ and 140˚ C. The cured epoxy was microtomed with a diamond knife, and the resulting surface imaged using tapping mode atomic force microscopy (AFM). The scan rate for AFM imaging was 1 Hz and the setpoint was set to 0.5. Under these conditions the phase image is a map of stiffness of the sample under study and a brighter region in the phase image corresponds to the hard phase.3 As shown in Figure 1, the phase images for epoxy cured at three temperatures are quite different. In 25˚ C cured samples, the hard phase volume fraction is smaller than when the epoxy is cured at 90˚and 140˚ C. This epoxy system generally has a glass transition higher than 60˚ C which means vitrification will happen during the cure at 25˚ C. As a result, chain diffusion will be slow at 25˚ C and the growth of the hard phase will be limited. For the 90˚ and 140˚ C samples, although they both have a high hard phase volume fraction, the sizes of the hard phase are quite different. Note that the scale in the 25˚and 140˚ C images are 1.0 µm while the scale in the 90˚ C image is 500 nm. The difference in the hard phase size implies that the 50˚ increase in cure temperature increases the chain diffusion rate much more than it increases the reaction rate, and thus a larger hard phase is formed.
Figure 1. Phase images of tapping mode AFM of
stoichiometric DGEBA cured by Jeffamine D230 at different temperatures. From
left to right: 25˚ C for 2 weeks, 90˚ C for 5 hours, and 140˚ C
for 2 hours. Note that the scale in the 25˚and 140˚ C images are 1.0
µm while the scale in the 90˚ C image is 500 nm.
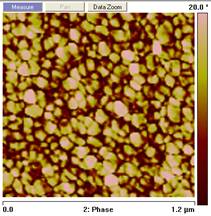
Our experiments also show that changes in the stoichiometric ratio between the epoxy and
the amine can also alter the two phase morphology. As shown in Figure 2, distinct
difference exists between the phase images
from epoxies cured at 140˚ C with different aimne to epoxy functional
group ratios. The stoichimotric sample has the highest hard phase content while
an epoxy rich sample has the highest hard phase size. Similar trends are also
observed in epoxies cured at other temperatures(not shown here). We believethat
the soft phase volume fraction is related to unreacted funtional groups in the
cured epoxy, while a larger size of hard phase implies a slower reaction rate
due to the non-stoichiometric ratio. Our further work will try to
develop a model to describe and predict the two phase morphology formation
during cure, followed by understanding and modeling the effect of the two phase
morphology on water diffusion in epoxy resins.
Figure 2. Phase images
from tapping mode AFM on epoxy cured at 140˚ C with different amine to
epoxy functional group ratios; from left to right the amine to epoxy functional
ratios are: 0.8:1, 1:1, 1.25:1. References:
1. Vanlandingham, M. R., Eduljee, R. F.
& Gillespie, J. W. Relationships between stoichiometry, microstructure and
properties for amine-cured epoxies. Journal
of Applied Polymer Science 71,
699-712 (1999).
2. Kishi, H. et al. Mechanical properties and inhomogeneous nanostructures of
dicyandiamide-cured epoxy resins. Journal
of Polymer Science Part B-Polymer Physics 45, 1425-1434 (2007).
3. Magonov, S. N.; Elings, V.; Whangbo, M. H. Phase imaging and
stiffness in tapping-mode atomic force microscopy, Surface Science 375,
L385-L391 (1997).