
46865-B6
Dissecting the Dynamics of Surfactant Assemblies with Numerical Fluorescence Correlation Spectroscopy
Numerical Fluorescence Correlation Spectroscopy (NFCS) follows the general protocol established for traditional Fluorescence Correlation Spectroscopy (FCS), but replaces analytical modeling with two numerical features: (1) a numerical map of the detection volume; (2) a computer simulation that produces correlation curves for scenarios that are difficult or impossible to model analytically.
The
first year of activity has involved developing mapping procedures for NFCS and
writing appropriate algorithms for the numerical simulation. (1) The production of numeric maps involves raster
scanning a small light-generating particle fixed to a microscope slide through
the detection volume. We have been using
fluorospheres purchased from Invitrogen. Our work indicates that 3D maps with adequate
signal-to-noise ratio require 30-60 minutes for acquisition. A subsequent 3D deconvolution
step is required to extract the correct size and shape from the raw data. (2)
We have implemented a random-walk diffusion algorithm for simulating free
molecular motion through a 3D confocal detection
volume that is defined the numeric map.
The software generates a record of photon-bursts over time for molecules
diffusing according to user-specified diffusion coefficients and emission
intensities. The simulator has
facilities to store the photon-burst record, perform autocorrelations, and fit
the autocorrelated data with a specified analytical
model. By comparing the diffusion
constant entered into the simulator with the diffusion constant produced by
fitting the resulting autocorrelation curve, the simulation parameters required
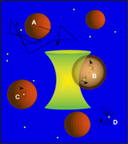
to produce accurate diffusion results have been defined.  Diffusion within and around vesicles and micelles is
difficult to interpret with traditional FCS due to the nanoscale
geometric constraints imposed on the fluorescent tracers. The approach under
development in our lab allows investigation of nearly any geometric scenario by
building obstacles or other diffusion constraints into the simulation
code. Thus, the simulator is able to
distinguish diffusive components in FCS data that would not be interpretable
otherwise. Example components include:
A, macroscopic motion of the vesicle; B) diffusion of tracers within the
vesicle; C) diffusion on the vesicle surface; D) free tracers moving in between
structures.