

45728-B6
Structure of Molecular Rydberg States in Supercritical Alkanes
Other participating researchers
Ms. Luxi Li and Mr. Xianbo Shi, candidates for the Ph.D., The Graduate Center -- CUNY, New York, NY, 10016
Ms. Gina Moriarty, undergraduate student, University of Louisiana at Monroe, Monroe, LA 71209 and Queens College -- CUNY, New York, NY 11367
Dr. Cherice M. Evans, Queens College -- CUNY, New York, NY 11367
Preliminary Studies
Before studying the structure of molecular Rydberg states in supercritical alkanes, we first performed a preliminary investigation of the structure of low-n atomic and molecular Rydberg states in supercritical argon, krypton and xenon. We obtained the vacuum ultraviolet absorption spectra of the xenon 6s and 6s' Rydberg states and the CH3I 6s and 6s' Rydberg states on the Aluminum Seya-Namioka beamline at the University of Wisconsin Synchrotron Radiation Center (NSF DMR DMR-0537588).
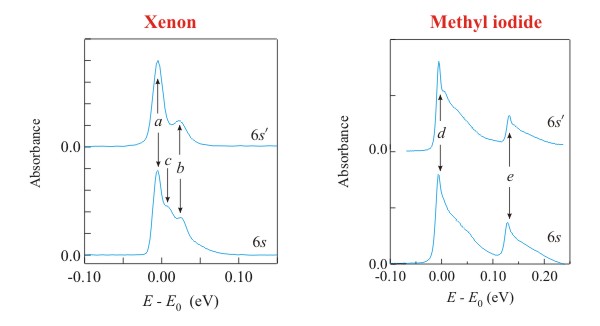
Fig. 1. Absorption spectra of the 6s and 6s' Rydberg states of xenon perturbed by 1.9 × 1021 cm-3 argon atoms and the 6s and 6s' Rydberg state of methyl iodide perturbed by 1.5 × 1021 cm-3 argon atoms. For the Xe 6s and 6s' Rydberg states, E0 = 8.437 eV and E0 = 9.570 eV, respectively. For the CH3I 6s and 6s' Rydberg states, E0 = 6.154 eV and E0 = 6.767 eV, respectively.
Fig. 1 shows the xenon and methyl iodide 6s and 6s' Rydberg states perturbed by argon. As the perturber number density increases, all of the observed bands (i.e., a - e) will merge to form a single band. Thus, obtaining the perturber induced energy shift Δ(ρP) [where ρP is the perturber number density] from a simple moment analysis of the primary transition of xenon or the adiabatic transition of methyl iodide is not possible with these data. However, if the experimental absorption bands can be accurately simulated for the entire density range with a single set of intermolecular potential parameters, Δ(ρP) can be determined from the moment analysis of the simulated primary (or adiabatic) transition.
Figs. 2 - 4 show a full line shape simulation (blue lines) in comparison to the absorption spectra (black lines) of the CH3I 6s Rydberg transition perturbed by argon (Fig. 2), krypton (Fig. 3) and xenon (Fig. 4) at noncritical temperatures (a) and on an isotherm near (i.e., + 0.5ºC) the critical isotherm (b). The simulation uses the fast Fourier transform of a semi-classical line shape function (convoluted with a Gaussian slit function) for each transition (i.e., transitions a - e in Fig. 1). The semi-classical line shape analysis depends upon the difference between the excited state dopant/ground state perturber and the ground state dopant/perturber intermolecular potentials, the dopant/perturber radial distribution function (RDF), and the perturber/perturber radial distribution function. Thus, these simulations yield a single set of ground state and excited state intermolecular potential parameters for each dopant/perturber system investigated.
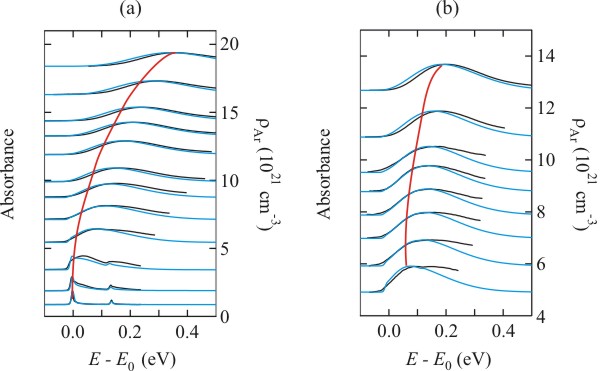
Fig. 2. Selected absorption spectra (black lines) and simulated line shapes (blue lines) of the CH3I 6s Rydberg state at (a) non-critical temperatures and (b) along the critical isotherm in supercritical argon. The data are offset by the argon perturber number density. The red line is an approximate peak position and is provided as a visual aid.
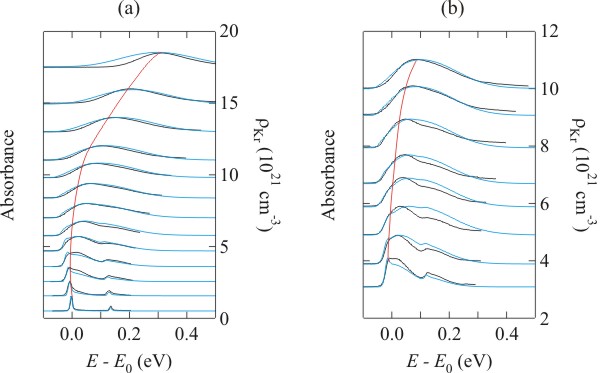
Fig. 3. Selected absorption spectra (black lines) and simulated line shapes (blue lines) of the CH3I 6s Rydberg state at (a) non-critical temperatures and (b) along the critical isotherm in supercritical krypton. The data are offset by the krypton perturber number density. The red line is an approximate peak position and is provided as a visual aid.
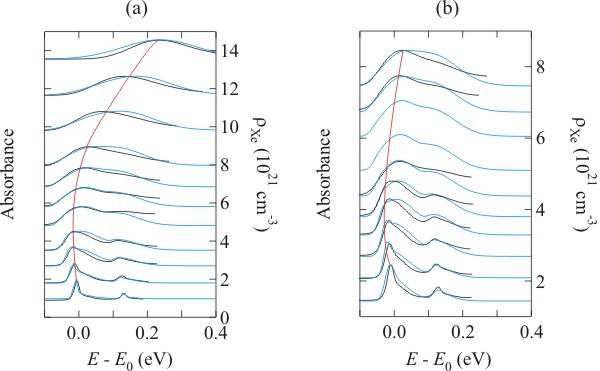
Fig. 4. Selected absorption spectra (black lines) and simulated line shapes (blue lines) of the CH3I 6s Rydberg state at (a) non-critical temperatures and (b) along the critical isotherm in supercritical xenon. The data are offset by the xenon perturber number density. The red line is an approximate peak position and is provided as a visual aid.
With a successful line shape simulation, a moment analysis can be performed on the primary (or adiabatic) transition to obtain Δ(ρP), which is presented in Fig. 5. Fig. 5 clearly shows a distinct critical point effect on the order of 30 meV. This effect results from an increase at the critical point of the perturber number density near a dopant atom, as reflected in the radial distribution functions that underlie the simulations presented in Figs. 2 - 4.
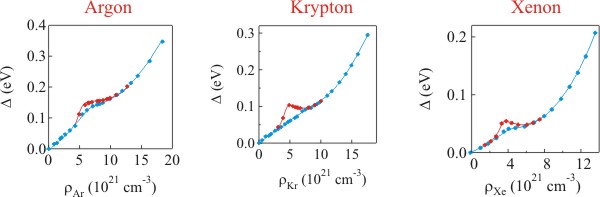
Fig. 5. The perturber induced shift Δ (as approximated by the first moment) of the simulated primary transition for the CH3I 6s Rydberg state as a function of perturber number density ρP at (●) non-critical temperatures and (●) near the critical isotherm. Solid lines are visual aids.
Current Studies
Having now shown that the semi-classical line shape function can be used to accurately simulate photoabsorption spectra of low-n Rydberg states perturbed by atomic gases, we are now measuring critical point effects on the electronic structure of methyl iodide in methane and carbon tetrafluoride.