ACS PRF | ACS
All e-Annual Reports

44915-AC7
Nanotomography of Liquid Crystals Using Near Field Scanning Optical Microscopy
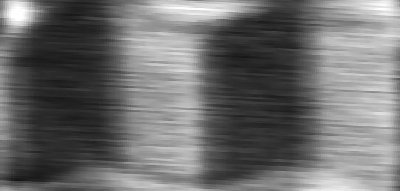
We plunge the optical fiber of a near field scanning optical microscope (NSOM) into a thin liquid crystal layer that sits atop a surface nanopatterned for orientational alignment. Using polarized light, the optical fiber is scanned in the xy-plane at various heights above the substrate, at distances ranging from about 80 to 600 nm. The images at each height represent a composite of the optical retardation from the end of the probe to the substrate, and the set of images can be deconvoluted to provide three-dimensional information of the liquid crystal order on length scales as small as 70 nm in the plane and 35 nm along the z-axis. During the past year our emphasis has been on obtaining reliable and reproducible images, with the first experiment designed to image directly the liquid crystal extrapolation length. A polymer-coated substrate was scribed with a herringbone pattern having a period of 7.5 microns. At the boundary between the left-tilting and right-tilting orientation, the liquid crystal director undergoes a bend deformation. The length scale over which this deformation occurs is twice the extrapolation length L, where L = K33/W. Here K33 is the bend elastic constant and W is the anchoring strength coefficient related to the energy of an orientational deviation at the surface from the local scribing direction. In our preliminary results and with the optical fiber residing 100 nm above the substrate, we observed that the deformation occurs over a length scale of approximately 250 nm, from which we can back out the anchoring coefficient W. As the fiber is raised and scans are made at heights more than 100 nm above the surface, we found that the optical signal varies over longer length scales. This behavior can be ascribed to two phenomena: a homogenization of the liquid crystal orientation away from the substrate, and an optical artifact due to the not-collimated light emerging from the NSOM fiber. At this stage the optical signals are being analyzed in order to separate the two effects, at which time the set of images will be deconvoluted to obtain a 3D mapping of the liquid crystal director. (Image shows dark and light stripes corresponding to the two different regions of the herringbone pattern. In this image the period is 5 microns and the optic fiber is approximately 300 nm above the substrate).