www.acsprf.org
Reports: DNI1048733-DNI10: Demonstrate the Feasibility of Using Triplet Polymers with Variable Bandgaps for Efficient Photovoltaics
Qiquan Qiao, PhD , South Dakota State University
Abstract
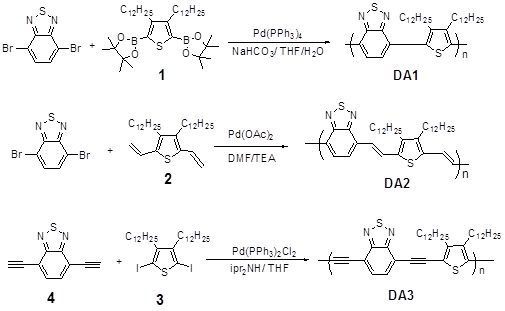
The femtosecond up-conversion fluorescence measurement showed that DA1 and DA3 exhibited a rise process for the energetically downhill excitonic energy transfer (EET) in a timescale of sub-ps to several ps, while DA2 exhibited a decay process in such downhill EET. DA2 showed the shortest time constant of ~ 4.6 ps for torsional relaxation. This suggested that the vinylene linker has the fastest torsional relaxation from a flexible ground-state structure to a more rigid planar geometry, which may reduce conformational defects and improve exciton migration.
Scheme 1. Chemical structures and synthesis routes for DA1, DA2, and DA3.
Discussion
The fitted parameters from Figure 1 are summarized in Table 1. The fluorescence dynamics of DA1 and DA3 were both measured at the emission wavelengths of 580 nm and
620 nm, while the emission wavelengths of 600 nm and 640 nm were used
for DA2. As shown in Table 1, the initial fast timescale,
ranging from sub-ps to several ps, showed a rising dynamics for DA1 and DA3 at both detection wavelengths, but a decay process for DA2.
This notably faster timescale was attributed to energetically downhill
excitation energy transfer (EET) from high-energy to low-energy segments. It
was noted that the fluorescence measured at shorter wavelengths exhibited a
much faster rise or decay time than those at longer wavelengths for all the
three samples. As the excitation energy
migrates down to lower energy long segments, the possibility for further
transfer to even lower energy long segments becomes less significant because
there are fewer lower energy segments that exist to which the excitation energy
can migrate when they keep moving energetically downhill. The rising dynamics at the emission of 580 nm
and 620 nm for DA1 and DA3 indicated that conformational
defects possibly slowed down the EET from 580 nm and 600 nm segments to even
lower energy segments, therefore leading to a net rising dynamics. However, in DA2, the ultrafast (a couple of) ps timescale showed a decay
process, which indicated that EET occurred very fast from 600 nm and 640 nm
emission segments to even lower segments, leading to a net decay dynamics. The τ2
processes at 38-89 ps for all samples may be assigned to the EET between
the segments with comparable energy that was reported to occur on a time scale
of approximately from ~10 ps to 100 ps.[1, 2] Figure 1. Fluorescence dynamics detected at two
different wavelengths for DA1 (580
nm and 620 nm), DA2 (600 nm and 640
nm) and DA3 (580 nm and 620
nm). Table
1. The fitted parameters for fluorescence dynamics detected at two different
wavelengths for DA1, DA2 and DA3, respectively.
Polymers Detection wavelength (nm) t1 (ps) A1 (%) t2 (ps) A2 (%) DA1 580 nm 0.25 -39 52 59 620 nm 1.7 -23 89 76 DA2 600 nm 1.4 33 63 65 640 nm 1.8 14 68 84 DA3 580 nm 0.28 -45 38 53 620 nm 7.4 -40 47 58 Figure
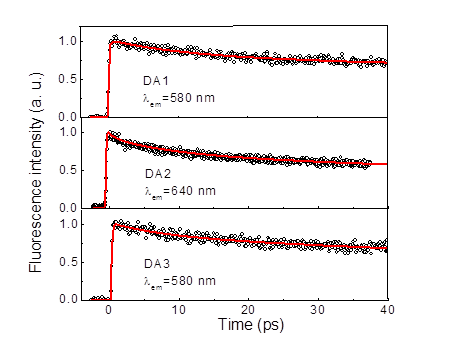
2. Fluorescence dynamics detected at 580 nm, 640 nm, and 580 nm for DA1, DA2, and DA3,
respectively. Table
2. The fitted parameters for fluorescence dynamics detected at 580 nm, 640 nm,
and 580 nm for DA1, DA2, and DA3, respectively.
Polymers Detection wavelength (nm) t1 (ps) A1 (%) t2 (ps) A2 (%) DA1 580 nm 13.2 23.6 445 75.4 DA2 640 nm 4.6 43.1 217 55.9 DA3 580 nm 8.1 17.8 189 81.2 The fitted parameters from Figure 2 are summarized in Table 2. As shown in Figure 2 and Table 2,
the τ1 component in DA1,
DA2, and DA3 was observed at 13.2 ps, 4.6 ps and 8.1 ps with amplitude at
23.6%, 43.1%, and 17.8%, respectively. The
τ1 process in this work can be assigned to the torsional
relaxation. Compared to DA1 (linked
without any group) and DA3 (linked
via an ethynylene group), DA2
(linked with a vinylene group) showed the shortest time constant of
~ 4.6 ps and the highest amplitude of ~ 43.1%. This suggested that the vinylene linker
showed the fastest torsional relaxation from a flexible ground-state structure
to a more rigid planar geometry, which could reduce conformational defects and
improve exciton migration. The slow
decay (τ2)
around
several hundred ps in Figure 2 and Table 2 may be assigned
to fluorescence from S1 to S0. Some other
groups also reported that hundreds of ps can be assigned to the relaxation from
S1 to S0 in oligothiophenes and polythiophenes.[2, 3] Impact of my career The ACS PRF DNI
grant has helped the PI to successfully establish his laboratory and have
provided critical startup funds to obtain preliminary data to seek additional
grants in his early career. With the
assistance of this ACS PRF DNI grant, the PI has been awarded the NSF CAREER
award. In addition, the postdoc who has
been supported by this ACS grant has also been greatly benefited by publishing
results from this grant and has established a strong foundation for his career. Acknowledgement Acknowledgment is made to Donors of the American Chemical
Society Petroleum Research Fund for support of this research. References [1] I.G.
Scheblykin, A. Yartsev, T. Pullerits, V. Gulbinas, and V. Sundström, Excited
State and Charge Photogeneration Dynamics in Conjugated Polymers. J. Phys. Chem. B. 111(2007) 6303-6321. [2] Y. Xie, Y. Li, L.
Xiao, Q. Qiao, R. Dhakal, Z. Zhang, Q. Gong, D. Galipeau, and X. Yan,
Femtosecond Time-Resolved Fluorescence Study of P3HT/PCBM Blend Films. J. Phys. Chem. C. 114(2010) 14590-14600. [3] T. Nakamura, Y.
Araki, O. Ito, K. Takimiya, and T. Otsubo, Fluorescence Up-Conversion Study of
Excitation Energy Transport Dynamics in Oligothiophene-Fullerene Linked
Dyads. J. Phys. Chem. A. 112(2008) 1125-1132.


