ACS PRF | ACS
All e-Annual Reports

43400-GB10
Dynamics and Kinetics of Gases on Carbon Nanotube Bundles
† Adsorption kinetics on linear chains: Groove-like and pore-like kinetics:
An undergraduate student, Jared Burde, participated actively in this project. The results were the subject of his first presentation in the American Physical Society and Carbon 2006 Conferences, and they were published in the Journal of Physical Chemistry in January of 2007.1
Two types of adsorption dynamics were considered: a) adsorption kinetics of groove-like phases (bundle's external sites) where the surface is directly exposed to the external gas, and b) adsorption kinetics of pore-like phases (tube's interior and ICs) where we assumed that gas adsorption inside the pore occurs provided the gas diffuses from the ends.
Groove-Like Kinetics:
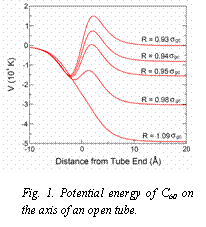
Fig. 1. Potential energy of C60 on the axis of an open tube.

For a fixed value of βε, the equilibration time decreases with increasing coverage, approaching to zero as the lattice becomes completely filled. Since higher pressures are needed to achieve larger equilibrium coverages, the adsorption rate increases, lowering the equilibration time. This decreasing trend was indeed confirmed later on by our experimental collaborators.2
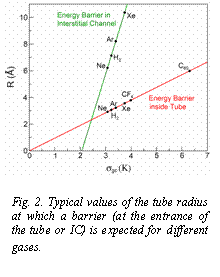
Fig. 2. Typical values of the tube radius at which a barrier (at the entrance of the tube or IC) is expected for different gases.

Pore-Like Kinetics: Equilibration times for pore-like phases exhibit a similar dependence with coverage as in groove-like systems but times are typically two orders of magnitude longer. In this case, important kinetic effects come from the potential barriers that can develop at pore entrances. Figure 1 illustrates the development of a potential barrier for C60 as the radius of the tube changes. Strong effects are expected whenever Rpore ~ 0.95 sgc. Using this general trend, we could predict the size of the nanotube that would induce the emergence of a barrier for different gases inside the tubes and in the ICs (Figure 2).
Combination of Internal and External Kinetics: If the tubes of the bundle are open, groove-like and pore-like adsorption are expected simultaneously. We showed that, in this case, the large difference in rates for the different sites can create the false appearance of equilibrium at those early times when the external chains have reached their equilibrium coverage but the pore-like phases are still far from equilibrium. This was indeed experimentally demonstrated for the first time by comparing the kinetics in open and closed-ended tubes.2<
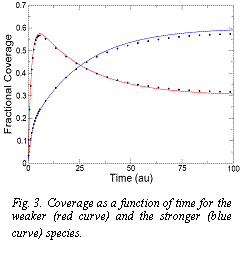
† Kinetic selectivity and competitive adsorption of a mixture: Based on our previous results that establish that higher binding adsorbates take longer to be adsorbed, during the adsorption process there would be a competition based both on the binding energies and the adsorption rates. Since the species with smaller binding will adsorb faster, it is expected that before reaching equilibrium, that species will be the favored one contrary to what will eventually happen in equilibrium. Figure 3 illustrates such effect. This phenomenon offers a novel type of selective process that could be exploited for separation processes. A graduate student that has recently joined our group is currently working in this project and results are being prepared for publication.
Fig. 3. Coverage as a function of time for the weaker (red curve) and the stronger (blue curve) species.

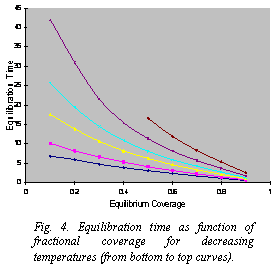
Fig. 4. Equilibration time as function of fractional coverage for decreasing temperatures (from bottom to top curves).

† Adsorption kinetics on external surface of bundle: In order to describe the adsorption kinetics on the whole external surface of a bundle, we considered three and five lines with different binding energies corresponding to the groove and lateral lines. In this case, even when the overall trend is expected to be similar to the groove-like line mentioned above, the presence of different binding energies gives rise to new processes that affect the kinetic behavior. This causes the equilibration time to deviate from the linear behavior. Figure 4 illustrates these effects on the equilibration time.