ACS PRF | ACS
All e-Annual Reports

42390-GB6
Simulating Linear and Nonlinear Optical Spectra in Condensed Phase Systems with a Mixed Molecular Dynamics and Quantum Mechanical Method
Background
Recently, a new computational method was developed that provides a strong connection between computational and experimental studies of solvation dynamics (I.R. Gould, and D.R. Klug, J. Phys. Chem. B , 1999, 103 , 7720-7727). This MD-QM method combines molecular dynamics (MD) calculations with quantum mechanics (QM) calculations and nonlinear optical theory to allow comparison directly at the level of the experimental observable.
While this MD-QM method shows promise and has been successfully applied to a number of interesting systems, careful studies of how the simulation results depend on a number of basic computational parameters have not been performed. In the research described here, we have examined a simple system---a dye dissolved in methanol---in detail, providing the kind of background data needed by researchers seeking to utilize this promising new method.
Methodology
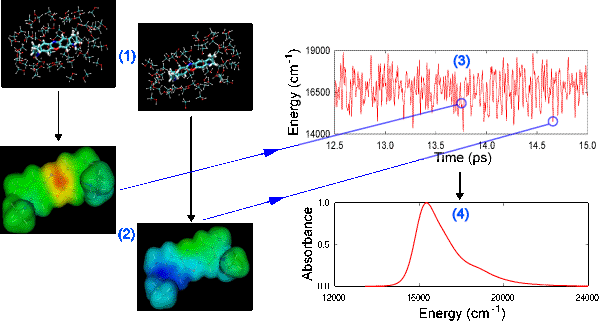
In the MD-QM method, classical MD is used to sample from all possible configurations, generating a time-ordered series of snapshots of the system (Figure 1). QM is then used to go back and evaluate the energy needed to excite the solute from the ground state to the first excited state for each snapshot (or every-other snapshot, or every third etc.), yielding the electronic transition energy as a function of time, U(t). Nonlinear optical theory allows transformation of U(t) into the optical line-broadening function, g(t). The line-broadening function is extremely powerful, allowing the observable of any optical spectroscopy to be simulated. In our case, we generate the (linear) absorption and emission spectra, as well as the (nonlinear) 3-pulse photon echo peak shift (3PEPS) spectrum.

 
Results
When carrying out these calculations, a number of parameters must be considered; three of these have been explored during our first year of grant support: 1) the QM model chemistry to use for evaluation of the electronic transition energy; 2) the amount of simulation time between QM evaluations of the electronic transition energy---the QM sampling time; and 3) the length of MD simulation---the trajectory length.
QM Model Chemistry
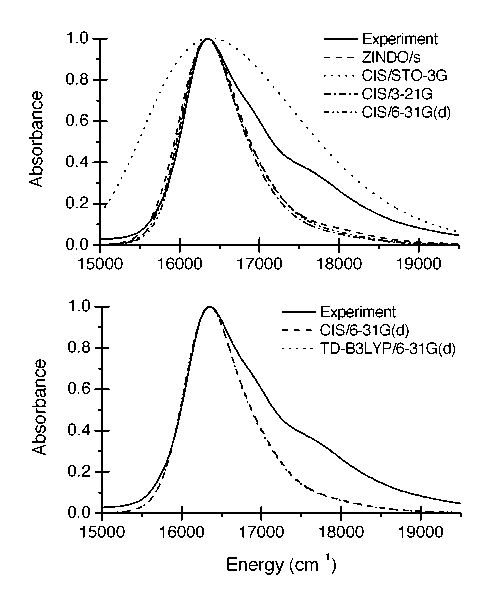
A number of QM model chemistries were examined, including the configuration interaction, singles (CIS) method with a variety of basis sets, the newer time-dependent density functional theory (TD-DFT) method also with a variety of basis sets, and the semiempirical INDO/s (ZINDO) method. One of the most exciting results is the success of the ZINDO method, which reproduces the experimental Stokes shift within 5 % and the experimental bandwidth (FWHM) within 20 % (Figure 2). These are strong results---the best results of all of the model chemistries that were evaluated---and are doubly exciting because ZINDO requires the least computational effort of all of the methods. For instance, each point requires 3 minutes for ZINDO evaluation and 70 minutes for CIS/6-31G(d) evaluation. Since 10,000-100,000 QM calculations are required, the time per QM calculation is a top consideration.

Figure 2. Dependence on model chemistry. The upper panel gives experiment, ZINDO/s and all three CIS model chemistries. The lower panel shows that CIS/6-31G(d) and TD-DFT/6-31G(d) give essentially identical results. All TD-DFT results are very similar to the corresponding CIS result. All data are from 25ps trajectories sampled every 2fs.
QM Sampling Time
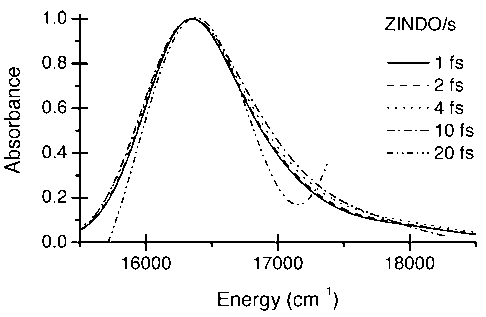
A sampling time of 4fs per point was found to be adequate for linear spectra and 2fs for non-linear spectra. These times are consistent with Nyquist sampling limits (Figure 3).

Figure 3. Dependence of the ZINDO results on the QM sampling time. All data correspond to 25ps trajectory lengths.
Trajectory Length
The success of the ZINDO model chemistry and our treatment of a relatively simple system have allowed us to explore much longer trajectory lengths than previously possible (300ps compared to 25ps). We found that a minimum of 20ps is needed for reasonable convergence of linear spectra, but that >100ps is needed for quantitative convergence (Figure 4).

Figure 4. Dependence of ZINDO results on trajectory length. The left panel shows the lack of convergence for trajectories <25ps in length. The right panel shows good convergence for trajectories >=25ps. All trajectories were sampled every 2fs.
Conclusions
Our first year of research resulted in the publication of the above results in the Journal of Computational Chemistry as well as related work in the Biophysical Journal. In the second year we have begun to extend this work by moving away from a simple classical description of forces during the MD simulations to a combined quantum/classical (QM/MM) description of the system. In conjunction with Dr. Ross Walker at The San Diego Supercomputer Center, we are working to modify the QM/MM implementation in the AMBER package to suit the needs of our MD-QM calculations.