ACS PRF | ACS
All e-Annual Reports

39160-AC2
Seawater History of Lithium Isotopes through the Mid-Cretaceous
Our ultimate goal is to document long-term changes in the 7Li/6Li ratio in seawater by measuring 7Li/6Li ratios in shells of planktonic forams recovered from deep ocean sediment cores. These variations reflect changes in the chemistry of seawater over geologic time driven by changes in silicate weathering of continents and seafloor delivering silica and cations (such as Li+) to the ocean, and removal of silicates and cations from the ocean into sediments and oceanic crust.
We discovered in trying to reproduce previous lithium isotope work that we needed to greatly improve the methods to obtain reliable data from the trace amounts of lithium in intrinsic foram calcite. We modified the column chromatography to separate lithium from cations that interfere with the MS, and also the isotope mass spectrometric methods themselves. We ended up producing a major improvement in lithium isotope analytical methods that will greatly facilitate not only this work but also analyses of lithium isotopes in individual mineral crystals and other Li mass-limited systems. Our high precision (±1ä, external 2s), low blank (<200 fg/ml) method uses a single collector ICP-MS (Agilent 7500cs). The method takes advantage of this ICP-MS's unique characteristics - a true hyperbolic quadrupole, stable mass bias at m/z = 6 and 7, cold plasma (600W) with chilled 2oC spray chamber, and very fast electronics to correct for dead-times up to 2 Mcps in isotope ratio pulse mode (peak jumping 2.6s/0.2s : 6Li/7Li). Each analysis (including Na, Ca and Mn) requires only 15 minutes of instrument time and 0.8 ng-Li.
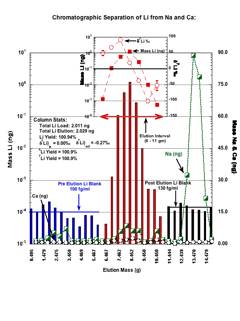
Column chromatography was required to remove other cations from lithium extracted from samples. These interfere with Li mass spectrometry by introducing instrumental fractionation effects. Lithium is a trace element in the Earth's crust (forams contain only 1 ppm Li) while interfering cations are major elements in seawater and Ca is a component of calcite. This column step requires (1) ultra-clean techniques to avoid contamination; (2) ultra-high sensitivity to resolve elution peaks; and (3) micro-manipulation of columns to work with tiny masses. A 17% mass difference between 6Li and 7Li, which makes Li isotopes a powerful tracer of geochemical processes, also promotes large and difficult isotope fractionations during laboratory chemical processing. Li strongly fractionates during chromatographic clean-up to remove Na+ (& K+) and Ca2+ (& Mg2+), from +100 ä in the leading edge to -100 ä in the trailing edge of elution peaks (see Fig.). Thus tiny incomplete recoveries of Li during column separations result in large and unrecognized isotope fractionation of eluent peaks. 100% recovery of eluents and full isotopic homogeneity are required.
We developed matrix matched (dissolved foram composition) isotope standards to monitor Na & Ca during column chromatography and MS analyses of Li isotope ratios. Li/Ca and Li/Na ratios in cleaned forams are 10 µmol/mol and 3 mmol/mol. A Quad ICP-MS tolerance limit of 20 ppb for Na and 20 µM for Ca was established. A single step chromatographic method to quantitatively separate Li from matrix elements using small volume resin (3.4 meq/2 ml AG50W-X8) and acid (6 ml 0.5N HCl) was developed. Our low blank (<0.2 pg/ml) and high yield (>99.9%) column method eliminates errors in measured Li isotope ratios associated with incomplete column recovery and presence of matrix elements.
High Li sensitivity (5 Mcps/ppb), low blanks (< 100 cps) and IR precision (±1ä, 2s) are achieved with an Agilent 7500cs using cold plasma (600W) to eliminate doubly-charged 12C and 14N interferences, soft extraction, and peak jumping on very small mass (Li = 0.8 ng) in 2 mL solutions of 0.4 ppb-Li taken up at 200 µL/min. Mass bias is +70 ä but constant.
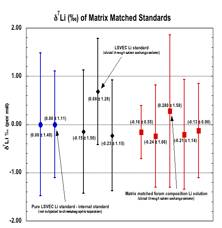
Fig. L: Comparison of pure LSVEC Li standard (2% HNO3 matrix) with same LSVEC standard and matrix matched foram composition (LSVEC) Li standard (high Ca & Na) eluted through columns. Blue circles are pure LSVEC Li standards not column separated (the internal standard). Black diamonds are same LSVEC standard passed through column. Red squares are matrix matched Li LSVEC standard passed through column. Each data point is an average of 5 analyses of 7 repetitions. Values are means and error bars are 2s.
Fig. R: Plot of Li, d7Li, Na, and Ca elutions from columns separating Li from Na and Ca averaged over 15 individual standard runs. Matrix matched foram composition Li (LSVEC) standard was load solution. 2.0 ng Li plus 1.16 mg Ca and 1.99 µg Na in 0.5 mL load volume. Each elution fraction was collected gravimetrically. Li concentration and isotope analyses were done in 2% HNO3 matrix using Agilent 7500cs Quad-ICPMS in cold plasma soft extraction mode using a maximum of 0.8 ng of Li per sample. and standard-sample-standard bracketing technique. A total procedural blank of 1.2pg was estimated from the average pre and post elution blanks.

