www.acsprf.org
Reports: ND549192-ND5: Development Of A Scattering Characterization Technique To Study The Nucleation And Growth Mechanism Of Supported Metals
During this reporting period the student Liliana Gámez has been working on the analysis of the high energy diffraction data obtained during multiple visits to beamline 11 ID-B of the Advanced Photon Source at Argonne National Laboratory for samples using zeolite faujasite, mordenite, and ZSM-5 as a support. Specifically, the analysis presented here has focused on the necessary steps for the modeling of the structural changes occurring during the synthesis of Pt particles supported on zeolites faujasite and mordenite. The structural refinement of zeolites mordenite and faujasite is presented along with the progress of the modeling of the Pt clusters. Also, and as stated in the prior report, transmission electron images have been obtained to aid in the modeling of the experiments.
Figure 1 shows the pair distribution functions (PDFs) obtained for two zeolite faujasite samples with a 1.5% wt Pt and 2.5% wt Pt loading calcined at a rate of 1°C/min after reduction (both were reduced at the same conditions). Among the changes that are observed in the PDFs after reduction of the Pt is that the peaks related to the zeolite atoms interatomic distances (identified in the figure) lose intensity while the peaks corresponding to the Pt-Pt interatomic distances increase in intensity. The explanation for the changes in the zeolites interatomic peaks is possibly due to the local rupturing of the local structure to accommodate the growing Pt particles. It is evident that the sample with a higher loading resulted in the most changes in the PDF suggesting that the Pt particles formed are, on average, larger than the sample with the lower loading. TEM images of these samples presented in Figure 2 show that this is indeed the case. Furthermore, these images show that the Pt size distribution is monodisperse and that the Pt is located mainly inside the pores of the zeolite.
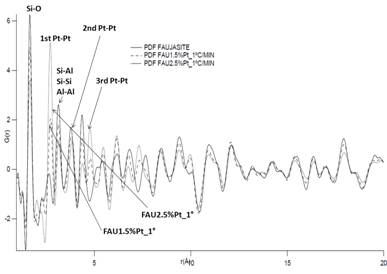
Figure 1. Experimental Pair Distribution Functions of Pt loaded faujasite samples after reduction calcined with a loading of 1.5% wt and 2.5% wt with the corresponding identification of the peaks.
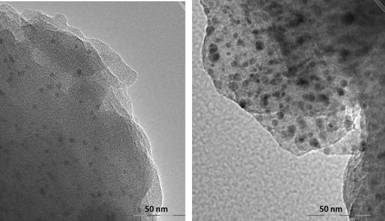
Figure 2. Transmission electron images of Pt-FAU: (a)1.5%Pt-FAU-1°C with average size=2.3 Å(σ=0.47) (b) 2.5%Pt-FAU-1°C with average size=3.44 Å(σ=1.52). standard deviation computed using σ=1/n-1[∑ σ12]1/2
Figure 3, on the other hand shows the TEM images of the 1.5 % wt Pt mordenite samples calcined at 1°C/min and 2°C/min after reduction. They show that both synthesis conditions resulted in the formation of some large Pt particles (>10 nm) apparently formed on the surface of the zeolite and it is evident that more of these larger Pt particles are formed on the sample calcined at a faster rate. These observations agree with the PDF results of these two samples (shown in Figure 4) where the zeolite atoms interatomic distances are not as affected as those of faujasite (suggesting less rupture of the local structure) and the Pt-Pt atomic peaks of the sample calcined at a faster rate are larger than the sample calcined at a slower rate. The formation of these larger particles is something that is reported in the literature as common for this zeolite but that poses an additional challenge for the modeling of the growth of these clusters. These results suggest that it is more feasible to obtain a single representative structural model from the results obtained for faujasite than for those obtained for mordenite.

Figure 3. Transmission electron images of 1.5% wt Pt-MOR calcined at a rate of (a) 1°C/min and (b) 2°C/min
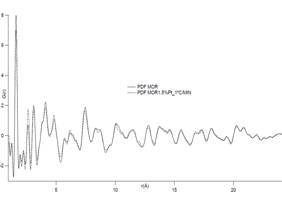

Figure 4. Experimental Pair Distribution Functions of the mordenite (MOR) and 1.5% wt Pt-mordenite samples after
reduction calcined at a rate of a) 1 °C/min and b) 2 °C/min
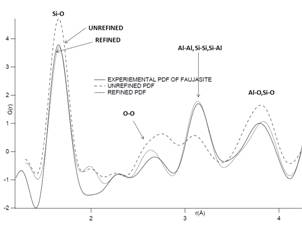
Figure 5. Unrefined and refined structure
faujasite PDF's compared to the experimental PDF The same type of real space
Rietveld refinement was done for mordenite and Figure 6 shows how the PDFs of
the as-published (a) and refined (b) structures compare to the experimental
PDF. After refinement the structure had an R-factor of 19.6 %.
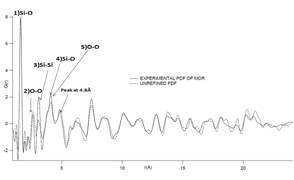
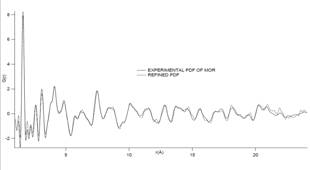
Figure 6. Experimental PDF of mordenite compared to a) the PDF
simulated using the as reported mordenite structure and b) the PDF of the
refined mordenite structure. The
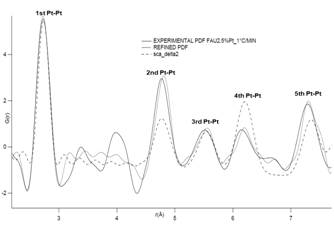
most relevant results obtained from the modeling of the Pt clusters are shown
in Figure 7; it shows the differential Pt PDF for the 2.5% wt Pt faujasite
sample The best starting structural model for was
the planar honeycomb 7,1 with seven
atoms and six faces reported in the literature as obtained from ab initio
calculations. This structure was optimized and refined and the final R-factor
was 25% for FAU2.5%Pt. The peaks labeled 1,2
and 3 correspond to the distances between atoms in the same cluster and peaks 4
and 5 as the distances between two adjacent clusters.
Figure 7. Experimental Pt differential PDF for the 2.5%
wt Pt-faujasite sample calcined at 1°C/min compared to the as reported planar honeycomb 7,1 Pt structure PDF and the refined
Pt structure PDF These
results will be included in two articles that are in preparation.