www.acsprf.org
Reports: DNI1049976-DNI10: 3-D Quantification of Catalysts in a Reducing Environment
The second year of this ACS PRF DNI grant is not the last year because we have requested (and been granted) a no-cost extension. The reason for this is because my student, Shaun Orr, received a fellowship from the department for his stipend and school fees for his first year. However, this grant supported Shaun fully for the year reported here. This year, the research that this grant has enabled has resulted in Shaun receiving one of the highly competitive Richard J. Kokes Travel Awards for graduate students. The Kokes Award provided funding for travel expenses (registration fee, lodging, and travel stipend) to attend and present at the North American Catalysis Society Meeting 2011 in Detroit, MI. This was a very exciting opportunity for Shaun, and one that graduate students need to build their confidence in the scientific community.
The aim of this proposal is to perform novel research into understanding the fundamental nanoscale mechanisms controlling the Fischer-Tropsch (FT) process by using a combination of 3-D imaging and in-situ/ex-situ gas experiments in the scanning transmission electron microscope (STEM). Fischer-Tropsch (FT) catalysts are being researched as one aspect of the solution to sustainable renewable resources because they are used to create a petroleum substitute from carbon monoxide and hydrogen, also known as synthesis gas, which can then be used to create a synthetic fuel. While extremely important as an industrial catalyst, much still needs to be understood in terms of the interface between catalyst and support, the catalyst's 3-D distribution in the support, and the catalyst's 3-D morphology within the support. Our previous research indicated cluster sizes of ~50nm for Co3O4 catalyst particles within either gamma- or alpha-alumina.
Now, we need to understand whether the 3-D morphology, size, and distribution remain the same when the Co is in its reduced and active state. The key to this research is combining 3-D imaging in the electron microscope (scanning transmission electron microscope (STEM) tomography) with reduction. We reduce the sample in two ways: 1) in an ex-situ gas chamber with a vacuum transfer holder where the gas pressures are not limited, but where we cannot directly visualize the reduction, and 2) in an in-situ gas stage where the gas pressure is limited to 1atm at most and we can directly visualize the reduction process, but we cannot perform the 3-D tomography with this stage. With the vacuum transfer holder, after the reduction has been performed in the ex-situ assembly, the door at the tip of the holder is closed and sealed with an o-ring, the holder is transferred to the electron microscope, and the door is opened again in the vacuum. In this way, the sample is not exposed to air and does not re-oxidize. This holder can then be used for atomic resolution imaging, chemical analysis using electron energy loss spectroscopy, and 3-D imaging in the STEM.
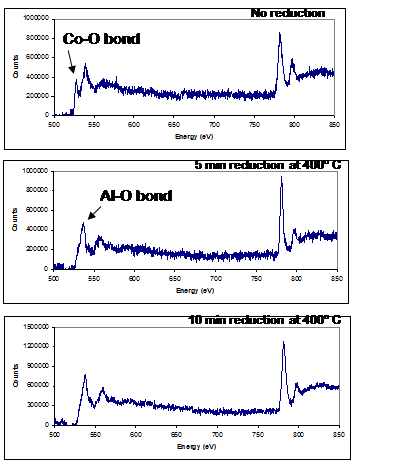
These methods will be applied to two systems: an unpromoted and promoted (with Pt) Co on Al2O3 FT catalyst before and after reduction. In this year, we have only analyzed the unpromoted catalyst and spent most of our time developing and setting up the equipment. We start by using the ex-situ gas assembly to correlate the 3-D morphology with the reduction of the catalyst. The reduction is performed using a mixture of gases (5% H2/95% N2) with heating provided by a CO2 laser at 400° C. The reduction is assessed by using electron energy loss spectroscopy (EELS) in the STEM by examining the fine structure of the O K-edge and the peak ratios of the Co L-edges, as will be shown below.
Figure 1 shows three representative STEM images and figure 2 shows three EELS spectra. The EELS spectra show the O K-edge and Co L2,3 edges before reduction, after 5 mins, and after 10mins of reduction. There are two main peaks in the O K-edge. The first peak at ~530eV is due to the Co-O bond, and the second peak at ~545eV is due to the Al-O bond. Since the catalyst sits in an alumina support, there will always be an O signal detected. Here we show that after 10mins of reduction, the pre-peak has diminished and we are certain the catalyst has been reduced. Due to limitation in space, all of the corresponding images cannot be presented, but three images taken at 25° tilt before reduction and after 5 and 10 mins are also shown. Comparing these images, it is clearly evident even in these 2-D images that the catalyst size, shape and distribution are changing in 3-D. The correlated 3-D reconstruction is being performed now, and a publication with these results will be disseminated shortly.
Lastly, progress has been made on the in-situ gas stage. While a reduction of the catalysts has not yet been performed in-situ, the in-situ stage has demonstrated atomic resolution within the stage both with and without gas (figure 3). This was tested on Au nanoparticles imaged through two electron transparent SiN windows of 50nm thickness and a spacer thickness of 150nm. With 1atm of gas present, atomic resolution was still achieved (figure 3(b)). These results are very encouraging, and the in-situ stage will be incorporated into the research more fully in year 2. By combining all of the methods, we should obtain a deeper understanding of the structure-property relationships of these important FT catalysts.
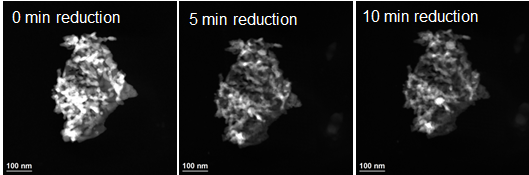
Figure 1. STEM images of FT catalyst as a function of reduction. The Co morphology and distribution (bright regions in images) is changing as a function of reduction.
 /p>
/p>
Figure 2. EELS spectra of the FT catalyst before and after reduction. The pre-peak of the O K-edge indicates that the Co is reducing.
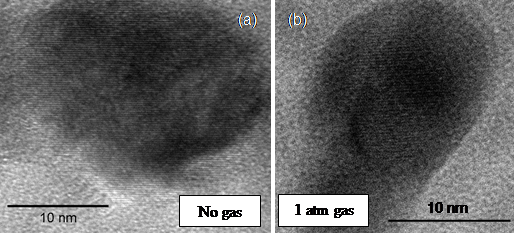
Figure 3. Atomic resolution images of Au nanoparticles in the in-situ gas stage. Atomic resolution is demonstrated (a) in vacuum and (b) in gas.