www.acsprf.org
Reports: AC548701-AC5: Nanoparticle Layer-by-Layer Assembly for Fuel Cell Electrodes
During Year 1 and 2 of this project, we demonstrated the synthesis of monodisperse Pt nanoparticles with atomic structures that span the cluster to crystal transition using electrostatically stabilized, aqueous-based suspensions. [1,2] During the final year of our investigations on this grant, the anionic charge from the stabilizing SnCl2 sheath adsorbed on the surface of these particles has been used to for the first time to assemble Pt directly onto porous carbon supports via electrostatic assembly (see Figure 1). High angle annular dark-field scanning transmission electron microscopy (HAADF-STEM) reveals that these assemblies have substantially higher Pt-C dispersions than obtained from precipitation methods commonly used for commercial electrocatalyst systems (see Figure 2) [3]. Energy dispersive spectroscopy (EDS) and inductively coupled plasma mass spectrometry (ICP-MS) have been used to determine that loadings of 10-30% by weight Pt (particle packing fractions from 0.05 to 0.25) are obtained through a single electrostatic application of these particles on Vulcan carbon, depending on particle size. The highest average oxygen reduction reaction (ORR) mass activity obtained using this approach is 90.4 A/gPt at 0.9 V vs RHE in 0.1Mperchloric acid is with 1-2 nm particles that exhibit a transitional atomic structure. This activity compares to an average value of 74.0 A/gPt obtained from densely packed electrostatic layer-by-layer (LbL) assemblies of unsupported particles and 36.7 A/gPt commercial Vulcan electrocatalyst from Tanaka Kikinzoku Kogyo (TKK).
Enhanced activity is observed with electrostatic assembly of all particle sizes on Vulcan carbon relative to unsupported or commercial electrocatalyst with comparable durability (see Figure 3). Such enhanced activity is attributed to improved reactant accessibility to the catalyst surface due to the increase in particle dispersion. An extinction coefficient of 7.41m2/g at 352 nm is obtained across the entire cluster to crystal transition from 20 atom clusters to 2.9 nm single crystal nanoparticles (see Figure 4), indicating that observed variation in ORR activity with particle size may be associated primarily with changes in atomic surface structure as opposed to the metallic character of the nanoparticles as assessed by UV-vis spectroscopy.
The doctoral student primarily funded by this project has recently received the prestigious 2011-2012 UC Graduate School Distinguished Dissertation Completion Fellowship (Samuel St. John) for his fourth year of doctoral study at the University of Cincinnati. His thesis was initiated by this ACS award.
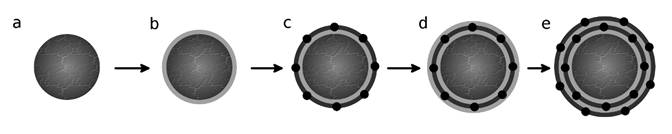
Figure 1: Schematic of electrostatic assembly of Pt nanoparticle on Vulcan carbon support illustrating the individual steps for two overall adsorption cycles: a) bare Vulcan support; b) first cationic polymer layer (light grey) adsorption; c) first Pt nanoparticle layer (dark grey) adsorption; d) second polymer adsorption; and e) second Pt nanoparticle adsorption. This schematic does not illustrate Pt nanoparticle deposition within the Vulcan carbon pores, which is evident in HAADF-STEM images of Pt-C electrocatalysts. The spacing depicted between nanoparticles is reflective of the experimentally determined surface disk electrodes.
|
|
|
|
Figure 2: Vulcan supported Pt electrocatalyst. White spots in HAADF-STEM image are transitional (non-crystalline) particles. (a) Magnification illustrates high dispersion formed during electrostatic assembly. (b) Magnification illustrates preservation of particle transitional structure and size during electrostatic assembly procedure.
 |
Figure 3: Average mass activity (A/gPt) plotted versus particle size (circles). Commercial catalyst (TKK) activity indicated by horizontal dotted line. Mass-Averaged Distribution (MAD) of face atoms for truncated, cubo-octahedron Pt particles is indicated by a solid line (111) face; and a dashed line (100) face x 10. MAD data presented here are based on calculations by Van Hardeveld et al.
 |
Figure 4: Beer-Lambert analysis of Absorbance versus specific mass data for different electrostatic assemblies of nanoparticles at 352 nm. Data obtained for 4, 10, and 20 bilayer structures on quartz for each synthesized nanoparticle. The different nanoparticle structures are indicated by (p) atomic clusters; (l) transitional nanoparticles; and (u) single crystal nanoparticles. Note the overlap in absorbance between the different categories of nanoparticles as the specific mass on the quartz surface varies.
References
(1) St John, S.; Dutta, I.; Angelopoulos, A. P. Journal of Physical Chemistry C 2010, 114, 13515.
(2) St. John, S.; Lee, D.; Dutta, I.; Angelopoulos, A. Journal of the Electrochemical Society 2010, 157, B1245.
(3) St. John, S.; Dutta, I; Angelopoulos, A.P. Langmuir 2011, 27, 5781.