www.acsprf.org
Reports: UNI649527-UNI6: Fundamental Studies of Atmospheric Pressure Microhollow Cathode Discharge Plasma Jet Interaction with Liquid Media
WeiDong Zhu, PhD , Saint Peter's College
The PMJ device comprises two
metal tubes separated from each other by a third insulating tube. The key
dimensions are the inter-electrode distance and the diameter of the exit
nozzle, which are 0.5 mm and 0.8 mm, respectively. Compressed air, helium/ oxygen
mixture were used as the working gas. Gas flow rate usually ranges from 0.3 to
5 standard liters per minute. The discharge sustaining voltage varies in the
range of 230 ¨C 600 V (depending on the working gas used and its flow rate) with
an operating current in the 3 ¨C 40 mA range. A schematic diagram of the PMJ
device as well as a picture of the plasma sustained in liquid can be found in
the previous annual report. This
report focuses on the interaction of PMJ with liquid media when PMJ is
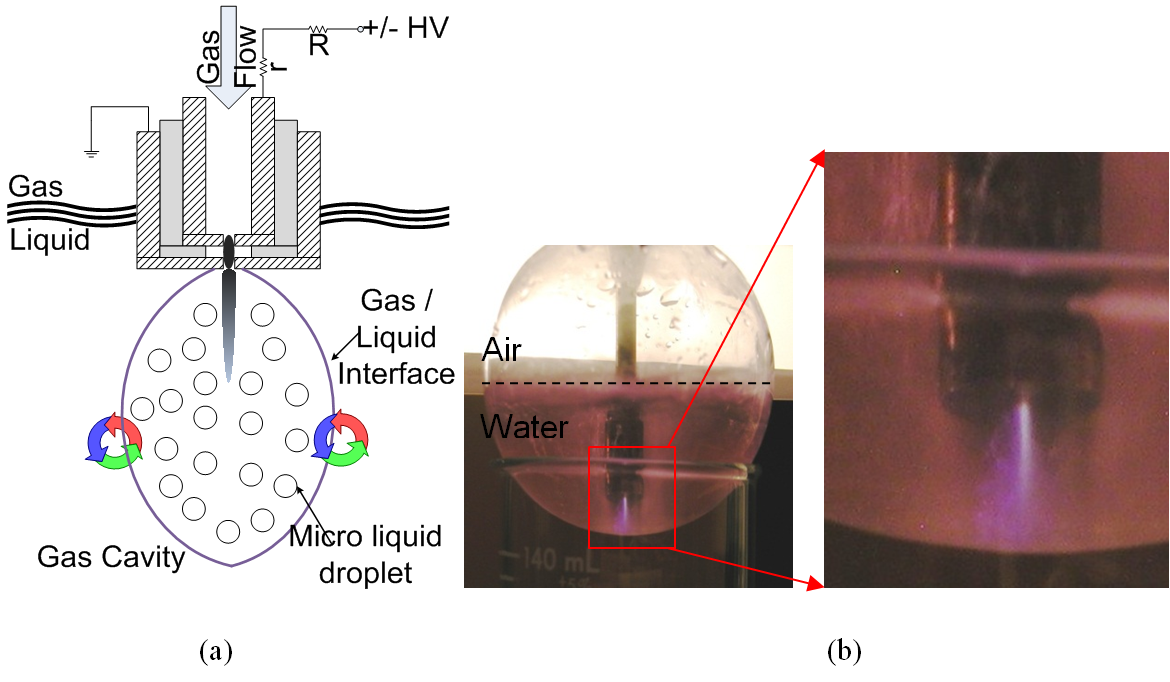
sustained in a quasi-steady gas cavity in liquid. Figure 1. (a) A schematic diagram of the PMJ generated in a
quasi-steady gas cavity in liquid
and (b) pictures of the PMJ (with compressed air as the feed gas) working
in deionized water with Rhodamine WT . When the tip of the device is
immersed in liquid media, the continuous gas flow through the orifice maintains
a quasi-steady gas cavity, which protects the powered electrode and
subsequently keeps the gas discharge plasma sustained (as demonstrated in
figure 1). The plasma activated species (such as ions, excited species, and
electrons) is directly injected into the liquid via the opening. Chemical
reaction of plasma activated species with liquid solution happens effectively
at the surface of the gas cavity and more importantly, on the surfaces of
micro-liquid droplets that exist within the gas cavity (as denoted by the
little circles within the gas cavity in figure 1 (a)). In one series of experiments,
200 ppb Rhodamine WT was used to purposely
contaminate 200 ml de-ionized water and subsequently treated with PMJ for one
hour. The concentration of Rhodamine WT was degraded
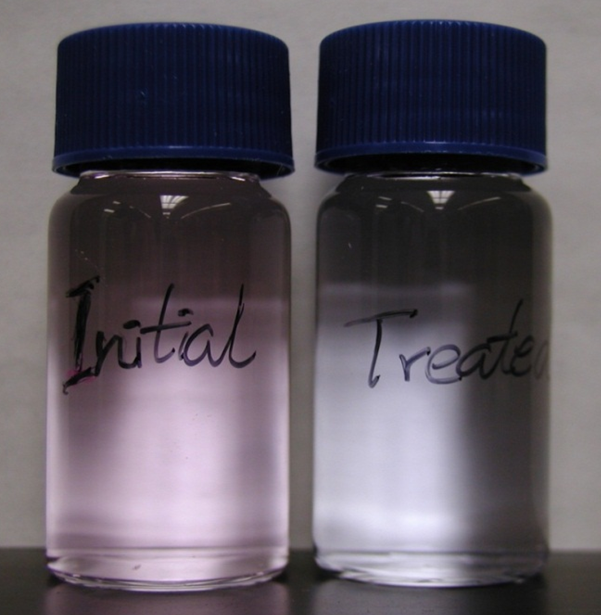
to ~ 80 ppb. Exemplary pictures of the initial liquid and the treated liquid are
shown in figure 2, qualitatively demonstrating the change of the concentration fo Rhodamine
WT. Figure 2. A picture of deionized water with Rhodamine WT contamination before and after 1 hour PMJ
treatment (totally treatment volume is 200 ml and with compressed air as
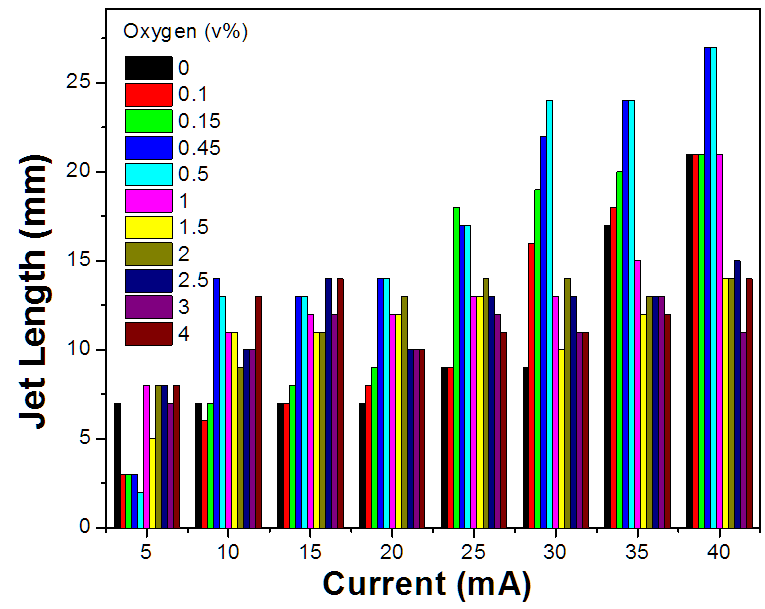
working gas). Figure 3. Jet length as a function of discharge current at
different oxygen volume concentration (flow rate: 2 standard liters per minute) No matter what gas is used as
the working gas and at what flow rate or discharge current, it is important
that a stable PMJ has to be generated in air before the interaction with liquid.
In the case of helium/oxygen mixture as working gas, a general trend observed
is that with the increase of oxygen concentration, the overall voltage needed
to sustain the plasma is increased. The visible length of the jet in general
increases with the increase of the discharge current (at oxygen concentration
below 1%). This phenomenon is not as obvious when oxygen concentration is
increased to above 1%. At a fixed oxygen concentration (<2%), the jet length
also increases with the flow rate until it reaches a plateau when entering the
turbulent mode (as shown in figure 4). Figure 4. Pictures
of a He/O2 (2%) plasma microjet (a) at
flow rates from 0.5 to 5 slm (diameter of the end cap
opening: 800 mm), Discharge current: 30 mA The transition from laminar
flow to turbulent flow happens between a flow rate of 2.5 slm
and 3.0 slm which correspond to Reynolds number
between 603 and 724. Atomic oxygen is considered
as one of the key components in the plasma generated species as they can
directly participate in the oxidation process of organic and inorganic species in
air and in liquid, as well as serving as the precursor of other reactive oxygen
species (ROS). Atomic oxygen (with optical emission at 777.4 nm) was monitored
via visible optical emission spectroscopy (OES) when different volume percent
of oxygen was added into helium carrying gas. It is interesting to note that
relative oxygen emission intensity reaches a peak value at around 0.1% oxygen
concentration (as shown in figure 5 (a)). This oxygen emission can originate
from the O2 added to the helium stream as well as the air
entrainment. Emission monitored from side-on of the jet at a distance 3 mm away
from the exit nozzle revealed similar trend. Figure 5. Relative optical emission of oxygen at 777.4 nm at
(a) different oxygen volume percent from end-on and side-on at 3 mm and (b)
different flow rate
When fixed
at a certain oxygen concentration (0.1%), the optical emission of oxygen peaks
at a flow rate of 4 slm. It is very likely that at a
higher flow rate, mixing of surrounding air exceeds the optimal oxygen volume
concentration that can lead to the maximum oxygen emission.
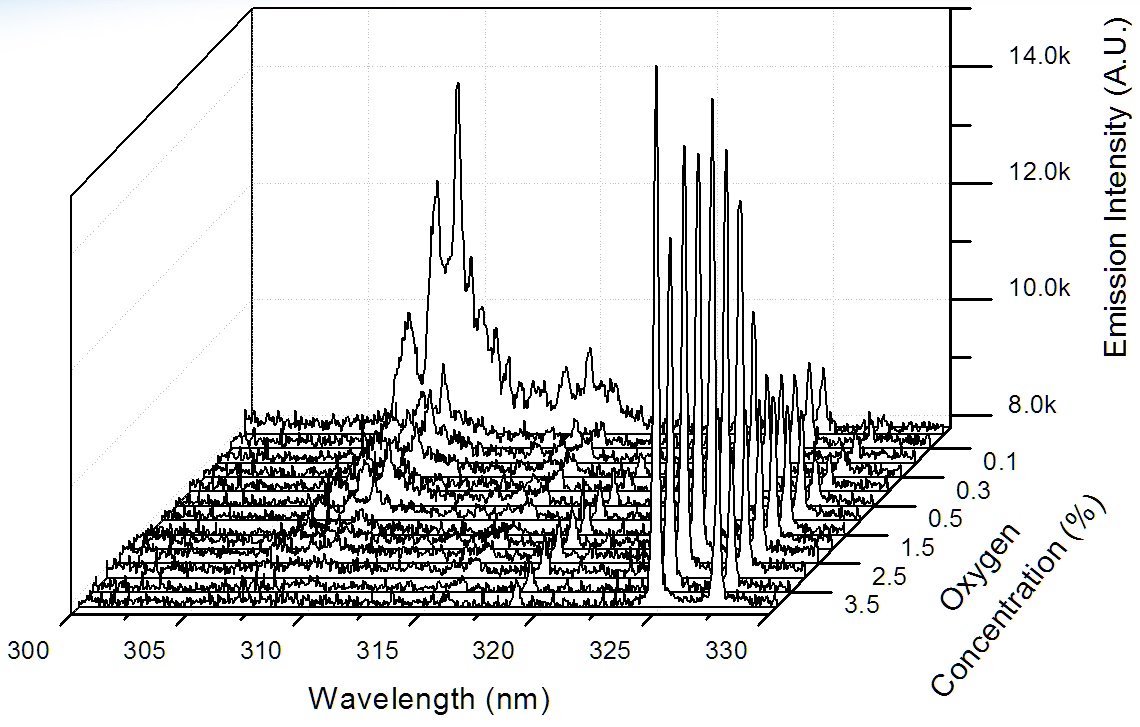
Figur 6. Optical Emission of OH (306-309 nm) and Cu (325 nm and
327 nm) at different oxygen concentrations Meanwhile, optical emission
of OH and Cu at different oxygen concentrations are also monitored and shown in
figure 6. OH emission peaks when no oxygen is added into the working gas, while
Cu emission increases with the increase of oxygen concentration. It is rather
difficult to monitor light emission when the PMJ is sustained inside water. Therefore
no emission spectra are recorded in those cases. This project has given me a
chance to work with students from high school level all the way up to senior
college students. In an undergraduate college, this experience is invaluable. I
am glad to see many of them graduate from high school and move on to
college/university, pursuing a science career because their experience in my
lab.


