ACS PRF | ACS
All e-Annual Reports

42732-G10
Scanning Tunneling Microscopy of Magnetic Oxides: Fundamental Studies of the Evolution of Magnetic Properties with Dimensionality
The goal of this project is to study the effect of dimensionality on complex oxides using scanning tunneling microscopy (STM) and spectroscopy. One of the interesting materials is ZnO that can be studied both as a bulk material and a nanowire. Nanowires need to be deposited on clean surfaces for STM studies. In order to clean metallic surfaces, we have purchased an Argon ion sputter gun. To deposit nanowires and nanotubes, we have installed and tested a pulse deposition valve (pulse injector) in our UHV test chamber. The pulse injector requires a power supply which can be controllably switched on and off with millisecond time constants. An undergraduate student (Dimitri Phillips) was responsible for designing and building the electronics as well as writing the labview programs to control it. This control electronics was successfully tested with the pulse injector.
For effective sample processing, we have been building a room temperature scanning tunneling microscope that will be fitted into our UHV chamber. The STM was designed and constructed by graduate student Shankar Kunwar. The STM has designed constructed with in situ tip exchange and eddy current damping. The STM was recently tested at room temperature in air on graphite and is currently being installed in our test chamber. Deposition of nanowires and nanomolecules will first be optimized with this STM.
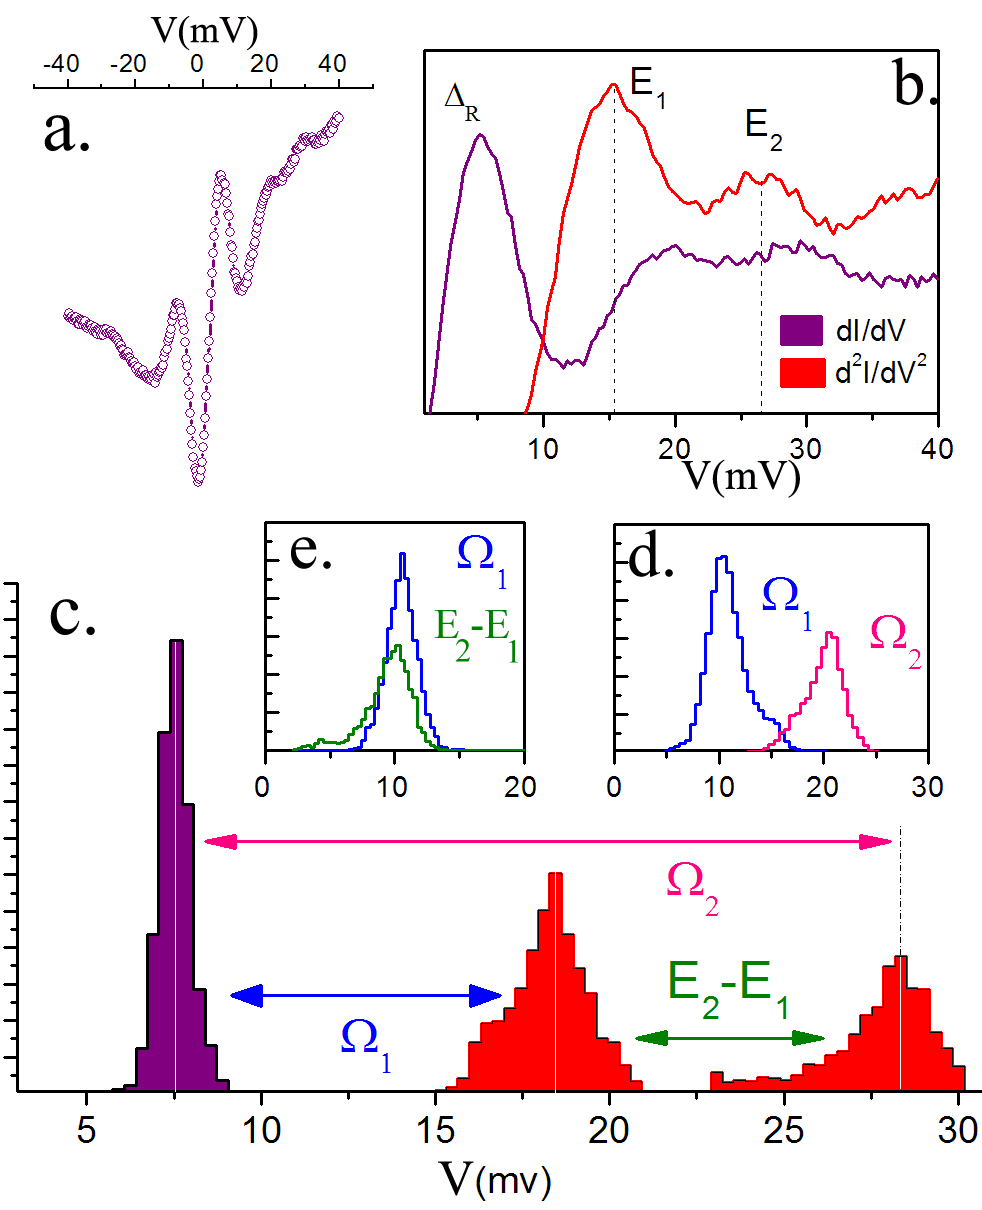
Using our low temperature STM, we have been performing studies on complex oxides which are examples of correlated electron systems. In one of our studies on the electron doped superconductor Pr0.88 LaCe0.12 CuO4-d (PLCCO) we have discovered a bosonic excitation that is coupled strongly to the electrons (figure 1). Such excitations could be candidates for the as yet unknown pairing mechanism in these high temperature superconductors. The energy scale of the bosonic excitation is 10.5±2.5 meV. This energy scale is the same as the magnetic resonance mode (spin-excitations) in PLCCO measured by inelastic neutron scattering but is also consistent with a low energy acoustic mode. Both the local mode energy and the intensity reveal correlations with the local gap energy scale. The sensitivity of the mode intensity to the energy scale of the onset of the continuum of excitations (2Δ) may indicate an electronic origin rather than phonons.
Figure 1: (a) A typical spectrum demonstrating the appearance of the modes. (b) The same dI/dV spectrum from (a) now shown only for energies greater than EF (purple line) with the linear background divided out. Now, the coherence peaks (at 7.0 meV) as well as other features outside the gap are clearly visible. The peaks in the second derivative (d2I/dV2) shown in red are defined as the mode energies E1 and E2. (c) A histogram of the occurrence of the peaks in dI/dV (purple) that represent the gap energy scale ΔR (the energy of the coherence peak), and peaks in d2I/dV2 (red) that represent the inelastic modes E1 and E2 in a 64Ĺ X 64Ĺ area of the sample. We calculate the average gap (Δav) in this region to be 7.7 ± 0.5 meV, while E1av= 18.5 ± 1.5 meV and E2av ~28 meV (our cut off at 30 meV for this analysis prevents us from obtaining full statistics for E2). (d) Following convention in superconducting systems, the mode energy referenced to the gap will be symbolized by Ω (i.e., Ωi = Ei - Δi) where Ei is the energy of the peak in the second derivative of the tunnel current. Ω1 calculated in two ways; E1- ΔR (blue) at a mean of 10.7±1 meV and E2- E1 (green) at a mean of 10 ± 1.7 meV. These are two independent variables and the remarkable overlap between these histograms lends weight to their identification as multiples of the same mode (e) Histogram of the mode energies Ω1 (blue) and Ω2 (pink) averaged over 8 maps in different areas of the sample with gaps ranging from 6.5 meV to 8.5 meV giving us an average Ω1av= 10.5 ± 2.5 meV. 