ACS PRF | ACS
All e-Annual Reports

38164-AC5
Optical Properties of Molecule-Based Magnets
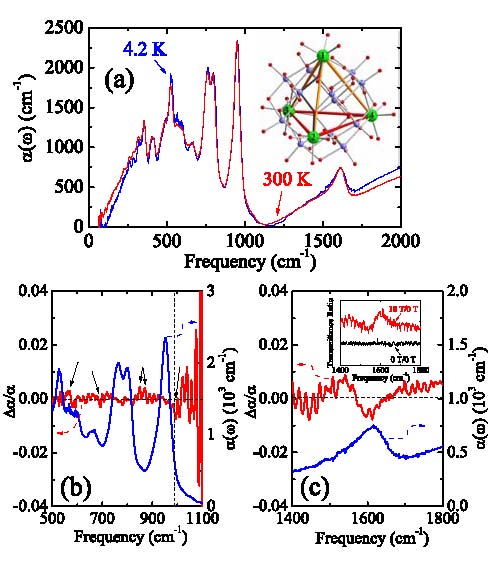
The molecular solid [MoV12O30(μ2-OH)10H2{NiII(H2O)3}4].14H2O, abbreviated Ni4Mo12, is comprised of magnetic clusters in which four Ni2+ centers are antiferromagnetically coupled, making it an excellent model compound with which to study the evolution of a non-magnetic molecular solid through a series of magnetic field-induced level crossings and saturation of the magnetization in the high field ferromagnetic state. In particular, we sought to test the suggestion that molecular structure (and thus interactions between spins) may be changing with applied magnetic field in Ni4Mo12. The rational is that an applied magnetic field may change local structure, which modifies orbital overlap, which can change the magnetic exchange parameter J. Our magneto-infrared measurements (Fig. 1) do provide evidence for small field-induced local distortions of the lattice in this system and at least a partial justification for invoking field-dependent magnetic parameters. The field-induced change in the localized H2O mode on the O attached to the Ni site is particularly evident (Fig. 1(c)). This result is consistent with our previous magneto-optics work indicating a small change in the Ni2+ crystal field environment at 30 T.
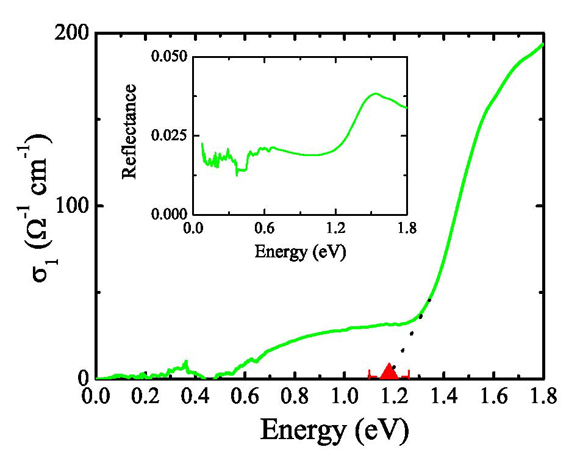
In response to the development of new theoretical methods to treat magnetic molecules that go beyond the traditional LDA + U and the need to benchmark these DMFT (dynamic mean field theory) based approaches on complex systems, we measured the optical properties of (pyH)3[Mn4O3Cl7(OAc)3].2MeCn, henceforth Mn4 (Fig. 2). Based upon these calculations, we assign the 1.8 eV peak to a superposition of Mn3+ to Mn4+ charge transfer excitations of the distorted [Mn4O3Cl]6+ core and d to d on-site excitations of the Mn centers. We find an optical gap of 1.18 ± 0.08 eV, in excellent agreement with DMFT predictions.
|
|
|
| Fig. 1. (a) Infrared absorption spectrum of Ni4Mo4 at 300 and 4 K. (b) close-up view of several vibrational modes along with absorption ratio data at 18 T and 4 K. Here, arrows mark several small Δα/α features that are just above the noise level. (c) Close-up view of the H2O-Ni wagging mode along with the absorption ratio data at 18 T. | Fig. 2. 300 K optical conductivity of Mn4 molecular magnet material, obtained from a Kramers-Kronig analysis of the measured reflectance (inset) on the [2,-2,1] crystal fave. The red triangle shows the estimated value of the optical gap with the corresponding error bar (1.18 ± 0.08 eV). |