Reports: AC8
43994-AC8 Morphological Modeling of Continental Slopes
Submarine canyons in the World's continental slopes form networks that can appear superficially analogous to those of river tributary networks. This research focuses on quantifying their geometries and attempting to explain how they arise. We are analysing digital elevation models (DEMs) of bathymetry derived from multibeam sonar surveys of slopes with diverse curvatures and canyon morphologies. Work includes classification of the submarine networks and analysis of their internal characteristics. Similarities and differences in geomorphologic parameters between different networks will then prompt a search for explanations in terms of similar or different physical properties of eroded substrates, erosion and sedimentary flow process and sedimentary or oceanographic environment.
The analysis initiated by reviewing the extensive literature on river networks to see how geomorphologists approach the problem. River networks can be subdivided into individual stream segments. Their network components are assigned channel orders via a hierarchical, discrete ordering method (Strahler, 1957). Systematic relationships between channel order number and various ensemble-averaged quantities of network components are observed for most river systems and are called Horton's laws (Horton, 1945). Applying the method to submarine channel networks is likely to be successful because stream ordering has been found to be applicable to many other kinds of branching networks (Dodds and Rothman, 2000).
The extensive research on submarine canyons has shown them to have been created by a variety of processes and, as with river networks, they have widely ranging morphologies and sizes (Shepard, 1968; Twichell and Roberts, 1982). As shown earlier by Pratson and Ryan (1996), extracting channel networks has the potential to provide a way of simply classifying submarine networks with few parameters. Modern "drainage extraction" software however, coupled with modern hardware, now allows a much wider range of characteristics to be derived for each network and the analysis can be done efficiently so that many networks can be analysed. We anticipate that, after an initial confidence-building stage based on study of the best-studied slopes, such an approach can more easily uncover anomalies or homogeneity that can be investigated further. Such approaches essentially extract a "drainage" network as though the topography collects rainfall runoff. Although rainfall may not have a simple analogue in underwater systems, by using the same approach we can use the same classification methods, while detailed investigation of geological and geophysical data is needed to interpret the processes occurring.
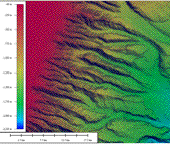
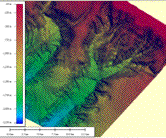
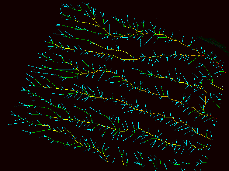
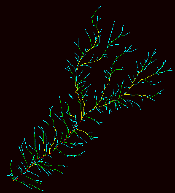
Our initial work has used "Rivertools" software to derive vector channel networks and their characteristics. The software provides traditional network attributes, such as contributing area, channel slope and length, and relations between the length of channels and their basin area (Hack's law). Results are shown here from two networks, which are visually different in shape and structure. The Ascension Slope canyons northwest of Monterey Canyon have dendritic shapes (Fig. 1a) whereas these USA Atlantic canyons are straighter with fewer tributaries (Fig. 1b). Fig. 2 shows networks extracted by the algorithm.
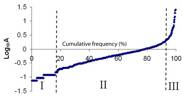
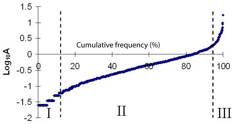
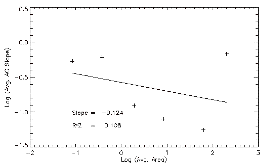
Fig. 3 shows cumulative histograms of the plan-view areas of two canyons (where "A" is the area contributing to the channel calculated at various points progressively down the channel). Anticipating, as with river basins, that the distribution could be normally distributed, the vertical axis is logarithmic. On such graphs, a normal distribution of A forms a straight line. Fig. 3 suggests three regions: I, the small sub-basins where A deviates strongly from the normal distribution (20% of the data); II, a normally distributed section covering 70% of the data; and III, broad channels in the lower slope comprising 10% of the data which deviate strongly. In terrestrial rivers, section I would correspond to locations where rill/gully erosion dominates while section II would characterise the main section of channelized river flow. In the submarine canyons, this division may instead partly separate small, steep slope depressions representing landslips (section I) from the main channels dominated by turbidity currents (section II). This is also suggested by gradient versus area plots (Fig. 4), which show a power-law relationship at large A where channellized erosion may have occurred but a more constant gradient at small A where the terrain gradient is stability limited.
Other geometrical properties analysed include Hack's Law exponents (describing how channel length varies with contributing area) and how gradient, area and drainage density vary between Horton-Strahler channel orders. The results so far show a surprising degree of consistency amongst the channel network components, aside from the low-order channels that we attribute to slope instability rather than erosion by sedimentary flows. This does not by itself demonstrate that the processes creating these networks are analogous to those occurring in rivers but it is an intriguing property of them. Further work will extend the analysis to networks with greater in situ information, e.g., New Jersey slope. The analysis can then be extended to a much wider range of slope systems, in a variety of locations.
Understanding how these different plan-view geometries arose is an important aim. Over the next year, we will explore explanations in terms of pre-existing slope morphology, resistance to erosion and large-scale slope failure. We hope that these results will assist Petroleum Geoscience by providing ways to evaluate the plan-view geometries of sand-bearing deposits on poorly surveyed areas as well as characterising networks in sites imaged with 3D seismic.
|
|
|
|
Fig. 1a. DEM of part of the USA Atlantic slope (data from NGDC). |
Fig. 1b. DEM of Ascension area slope canyons northwest of Monterey Bay, California (data courtesy of the MBARI). |
|
|
|
|
Fig. 2a. Extracted networks - Atlantic USA. |
Fig. 3b. Extracted networks- Ascension slope. |
|
|
|
|
Fig. 3a. Cumulative area distribution - Atlantic slope. |
Fig. 3b. Cumulative area distribution - Ascension slope. |
|
|
Fig. 4. Slope-area relations for the Ascension slope. As contributing area increases, a break in gradient of the graph occurs at an area of around 10 km2, marking a change from hillslope processes (gradient limited by slope stability) to those where turbidity current erosion leads to a power-law relationship. (The point at extreme right is an error; please ignore regression line.) |