Reports: G10
46499-G10 Spark Plasma Sintering of Ceria Materials for Solid Oxide Fuel Cells Applications
Solid oxide fuel cells (SOFCs) use protons or oxygen anions as charge carriers and have the potential to become a power generation system of choice for the conversion of chemical to electrical energy. Ceria (CeO2) has unique catalytic, electrochemical and storage characteristics that makes it attractive for a large array of applications, such as catalysts, solid oxide fuel cell systems, and gas sensors.
Experimental procedure
In this work, the high purity cerium hexahydrate Ce(NO3)3×6H2O (99.99% Sigma Aldrich), gadolinium hexahydrate Gd(NO3)3×6H2O (99.99% Sigma Aldrich), ytterbium pentahydrate Yb(NO3)3×5H2O (99.99% Sigma Aldrich) and samarium hexahydrate Sm(NO3)3×6H2O (99.99% Sigma Aldrich) were used as starting materials for the synthesis of doped ceria powders.
The powders were densified by SPS. The SPS densification experiments were performed with a laboratory apparatus capable of delivering 4800 A and 150 kN load, under vacuum. The temperature was raised to 1100 ℃(or 1200 ℃) with a heating rate of ~200 ℃ min-1. The holding time at 1100℃ (or 1200 ℃) was 1 min. The resulted samples were characterized by SEM, TEM and EIS.
All peaks in the XRD spectra of the powders were coordinated to standard cubic CeO2 with slight shifts and had no other peaks, which indicate that the rare earth metal ions doped the CeO2 crystal lattice. Particle size analysis from TEM indicated that Yb3+ doping resulted into a notable smaller particle size than in the case of Gd3+ and Sm3+ doping. Compared to Gd3+ and Sm3+,which prefer to be eight coordinated, the same as Ce4+, while the smaller Yb3+ cations prefer to be six coordinated. Figure 1 shows the SEM images of fractured M0.2Ce0.8O2-x samples, which were obtained by SPS sintering at 1100℃. Although not completely avoiding grain growth during sintering, the high heating rate during SPS is beneficial in restraining it. Grain size analysis of the experimental SEM data showed that the average grain size of Sm3+ doped CeO2 grains was 80 nm, while the average grain sizes of Yb3+ and Gd3+ doped CeO2 were 94 nm and 160 nm, respectively.
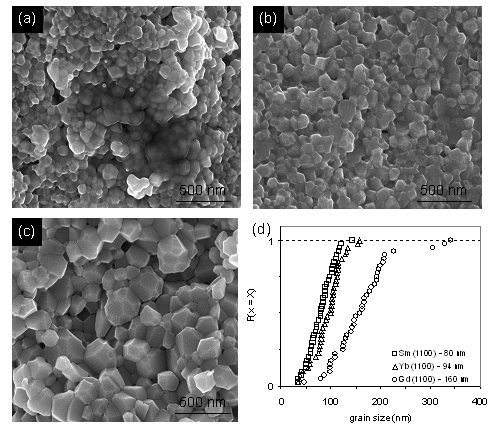
Figure 1. SEM images.
Figures 2, 3 and 4 show a collection of TEM images of all SPS sintered samples. TEM examination showed no segregation of metal oxide or formation of any secondary phase in these bulk samples, whatever the sintering temperature and the metal doping was.
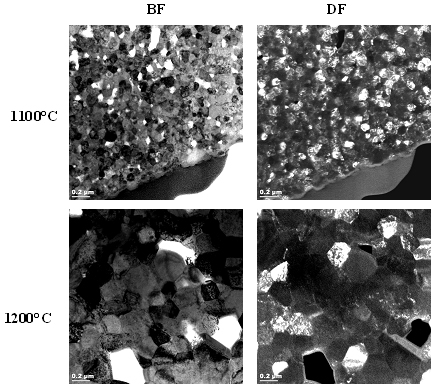
Figure 2. TEM images of samarium-doped SPS sintered ceria.
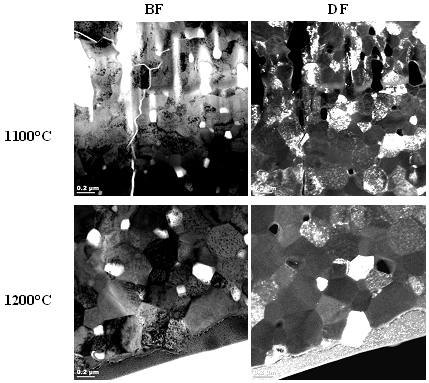
Figure 3. TEM images of yterbium-doped SPS sintered ceria.
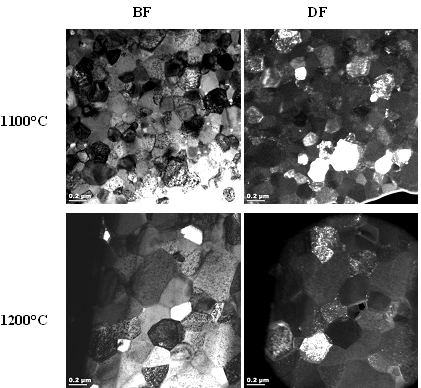
Figure 4. TEM images of gadolinium-doped SPS sintered ceria.
For comparison SPS sintering of the same samples at 1200°C was performed and the samples were subsequently analyzed by TEM and SEM. The results indicated that and increase in the maximum sintering temperature from 1100°C to 1200°C significantly influences the final grain size of the samples.
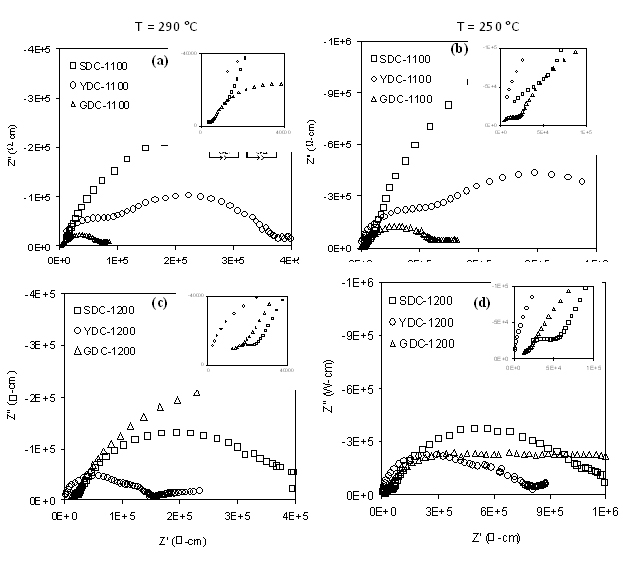
Figure 5. AC impedance spectra of the SPS-sintered M3+-doped ceria samples.
Figure 5 shows the AC impedance spectra of the SPS-sintered M3+-doped ceria samples taken at 250°C and 290°C. In each case, two depressed arcs were observed corresponding to bulk, grain boundary and electrode/ electrolyte interface. The first high frequency arc from left was associated with conductivity derived from the bulk (grain interior) and grain boundary conductivity owing to the high frequency less than 1 MHz. The second low frequency arc was assigned to the impedance associated with the electrode/electrolyte interface that corresponds to oxygen ionic conduction. The total resistivity values of the samples were determined from the low-frequency intercept on the real axis in the impedance spectrum. From Figure 5, we can infer that the GDC sintered at 1100°C has the lowest total resistivity, and therefore the highest ionic conductivity.