Reports: B6
45728-B6 Structure of Molecular Rydberg States in Supercritical Alkanes
Other participating researchers
Dr. Luxi Li and Dr. Xianbo Shi, The Graduate Center -- CUNY, New York, NY, 10016. Both graduate students successfully defended their dissertations on April 15, 2009.
Ms. Gina Moriarty, graduate student, University of Louisiana at Monroe, Monroe, LA 71209 and Queens College -- CUNY, New York, NY 11367.
Ms. Cathy Le, Ms. Feng Chen, Mr. Xiang Li and Mr. Huixi Zhu, undergraduate students, University of Louisiana at Monroe, Monroe, LA 71209 and Queens College -- CUNY, New York, NY 11367.
Dr. Cherice M. Evans, Queens College -- CUNY, New York, NY 11367.
Introduction
Last year, we performed a preliminary investigation of the structure of low-n atomic and molecular Rydberg states in supercritical argon, krypton and xenon. We showed that low-n dopant Rydberg states in atomic dense fluids could be accurately simulated using a fast Fourier transform of a semi-classical line shape function (convoluted with a Gaussian slit function). This semi-classical line shape analysis depended upon the difference between the excited state dopant/ground state perturber and the ground state dopant/perturber intermolecular potentials, the dopant/perturber radial distribution function (RDF) and the perturber/perturber RDF. The successful line shape simulation allowed a moment analysis to be performed on the simulated primary transition. This moment analysis showed that the perturber-induced energy shift of the primary transition exhibits a clear critical point effect near the critical density of the perturber. During this year, we obtained the vacuum ultraviolet absorption spectra of the CH3I 6s and 6s' Rydberg states in methane on the Seya-Namioka beamline at the University of Wisconsin Synchrotron Radiation Center (NSF DMR-0537588).
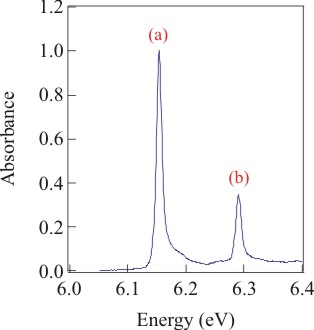
Figure 1 (left) shows the methyl iodide 6s Rydberg state perturbed by 0.5 × 10²¹ molecules of CH4/mL (i.e., a CH4 density of 0.01 g/mL). As the perturber number density increases, however, band (a), corresponding to
![]() ,
,
and band (b), corresponding to
![]()
will merge to form a single band. Thus, obtaining the perturber induced energy shift Δ(ρP) [where ρP is the perturber number density] from a simple moment analysis of the adiabatic transition [i.e., band (a)] of methyl iodide is not possible with these data. However, if the experimental absorption bands can be accurately simulated for the entire density range with a single set of intermolecular potential parameters, Δ(ρP) can be determined from the moment analysis of the simulated adiabatic transition.
Figures 2 and 3 show a full line shape simulation (blue lines) in comparison to the absorption spectra (black lines) of the CH3I 6s and 6s' Rydberg transitions, respectively, perturbed by methane at noncritical temperatures (a) and on an isotherm near (i.e., + 0.5ºC) the critical isotherm (b). The simulation uses the fast Fourier transform of
![]()
convoluted with a Gaussian slit function for each of the bands in Figure 1. In this semiclassical line shape equation, A1(t) represents the average two body interactions between the excited state dopant and the ground state perturber and, therefore, is a function of the ground state dopant/perturber radial distribution function gPD(r), and of the difference between the excited state dopant/perturber and ground state dopant/perturber intermolecular potentials [Ve(r) and Vg(r), respectively]. A2(t) gives the average three body dopant/perturber interactions. Within the Kirkwood approximation, A2(t) is a function of both gPD(r) and the perturber/perturber radial distribution function gPP(r), as well as Ve(r) and Vg(r). Thus, these simulations yield a single set of ground state and excited state intermolecular potential parameters for each dopant/perturber system investigated.
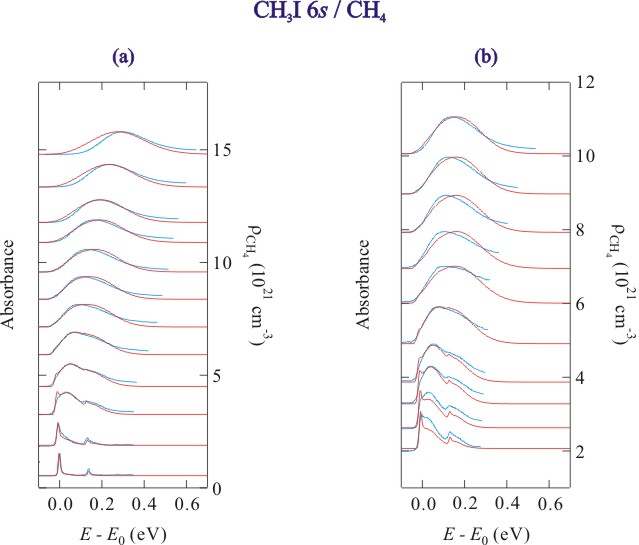
Figure 2. Selected absorption spectra (blue lines) and simulated line shapes (red lines) of the CH3I 6s Rydberg state at (a) noncritical temperatures and (b) along an isotherm near the critical isotherm of methane. The data are offset by the methane number density.
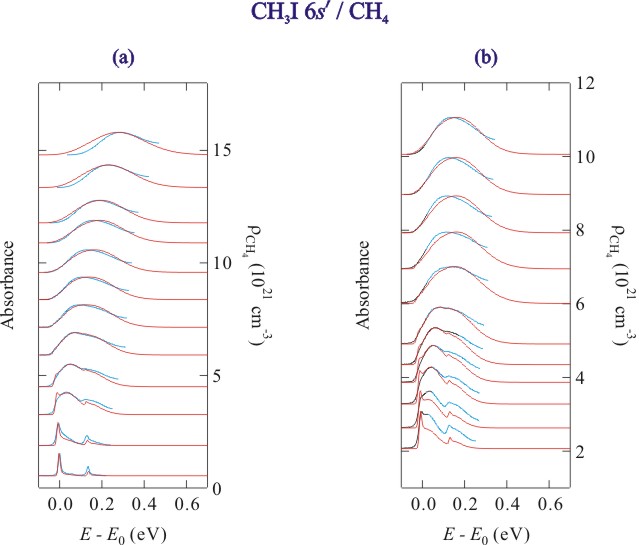
Figure 3. Selected absorption spectra (blue lines) and simulated line shapes (red lines) of the CH3I 6s' Rydberg state at (a) noncritical temperatures and (b) along an isotherm near the critical isotherm in methane. The data are offset by the methane number density.
With a successful line shape simulation, a moment analysis can be performed on the primary (or adiabatic) transition to obtain Δ(ρP), which is presented in Figure 4. Figure 4 clearly shows a distinct critical point effect on the order of 50 meV, making this effect 20 meV larger than that observed in the rare gases. This effect results from an increase at the critical point of local perturber number density [i.e., ρloc = ρP gPD(r)] near a dopant atom.
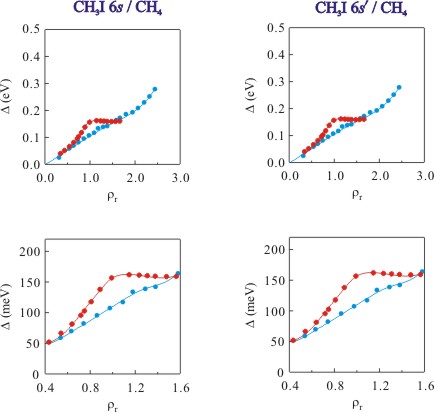
Figure 4. The perturber induced shift Δ (as approximated by the first moment) of the simulated primary transition for the CH3I (a) 6s and (b) 6s' Rydberg states as a function of reduced number density ρr (where ρr = ρ/ρc with ρc = 6.07 × 1021 cm-3) at (●) noncritical temperatures and (●) near the critical isotherm. Solid lines are visual aids.
Current Studies
Having shown that the semi-classical line shape function can be used to accurately simulate photoabsorption spectra of low-n Rydberg states perturbed by atomic gases (Fiscal Year 2007-2008) and CH4 (Fiscal Year 2008-2009), we are currently investigating critical point effects on the electronic structure of xenon and methyl iodide in carbon tetrafluoride. This system will be more difficult to model, since we cannot vet the ground state dopant/perturber and perturber/perturber intermolecular potentials using data from our studies of the quasi-free electron in dense fluids.