Reports: G5
47187-G5 Solvent Effects on Water Restructuring and Electrokinetics at Water-Hydrocarbon Interfaces
Summary
We studied the electrokinetic properties of silica and TOPAS microfluidic channels as a function of the time history of the fluid-solid interface using time-resolved streaming potential and current monitoring experiments. In pressure driven flow of aqueous solution through TOPAS microchannels, the zeta potential as inferred from streaming potential experiments was observed to decay exponentially by a factor of 1.5 with a characteristic decay time of 3 hours, after the initial formation of the fluid-solid interface. Exchanging water for ethanol as the solvent in the system was found to produce a similar exponential decay of the zeta potential. The zeta potential as inferred through current monitoring experiments was constant in time in electroosmotically driven flow through TOPAS microchannels. No electrokinetic transients were observed in silica microchannels under these flow conditions.
Detailed procedures for phase-sensitive streaming potential experiments and automated current monitoring experiments are described in published works (See Publications). We measured the ζ-potential as a function of time (1) in pressure driven flow inferred from streaming potential measurements, (2) in electroosmotic flow inferred from current monitoring experiments, (3) in pressure driven flow after an initial exposure to an electric field, and (4) after exchanging ethanol as the solvent in the system for water. Time-Resolved Electrokinetic Measurements in Pressure Driven Flow
|
|
|
| (a) | (b) | (c) |
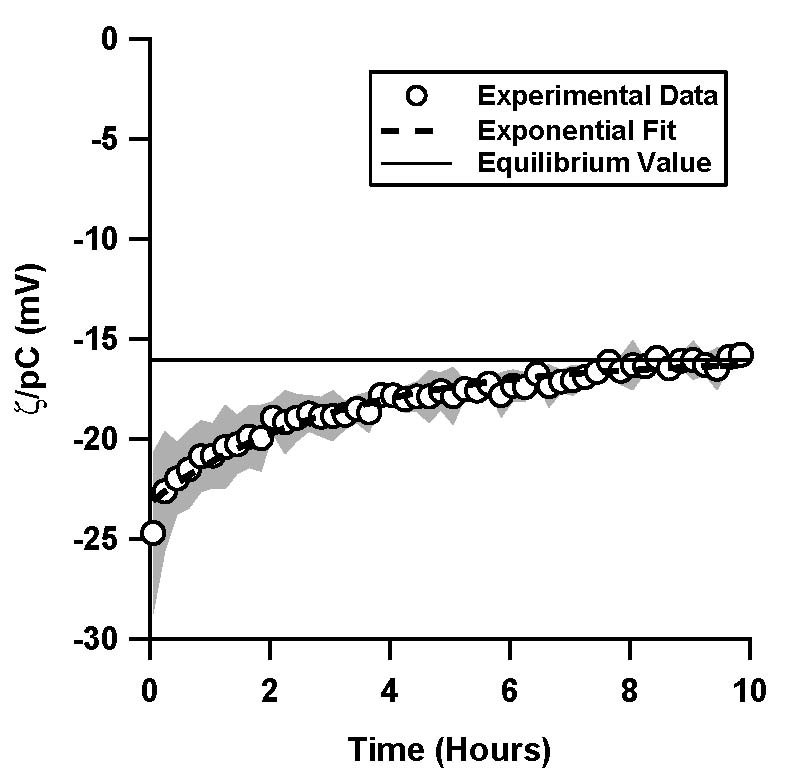
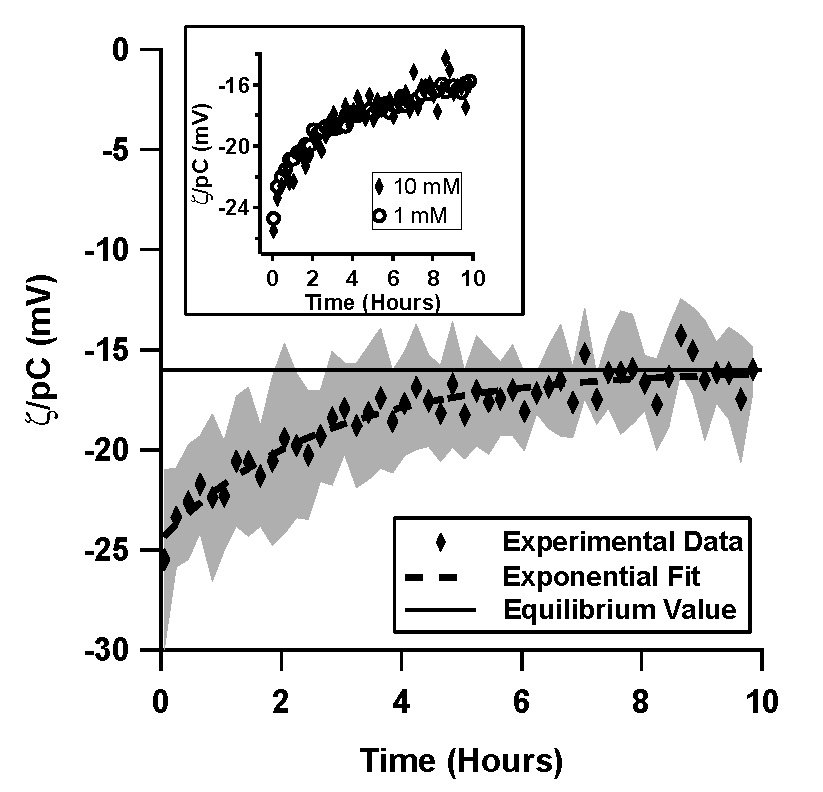
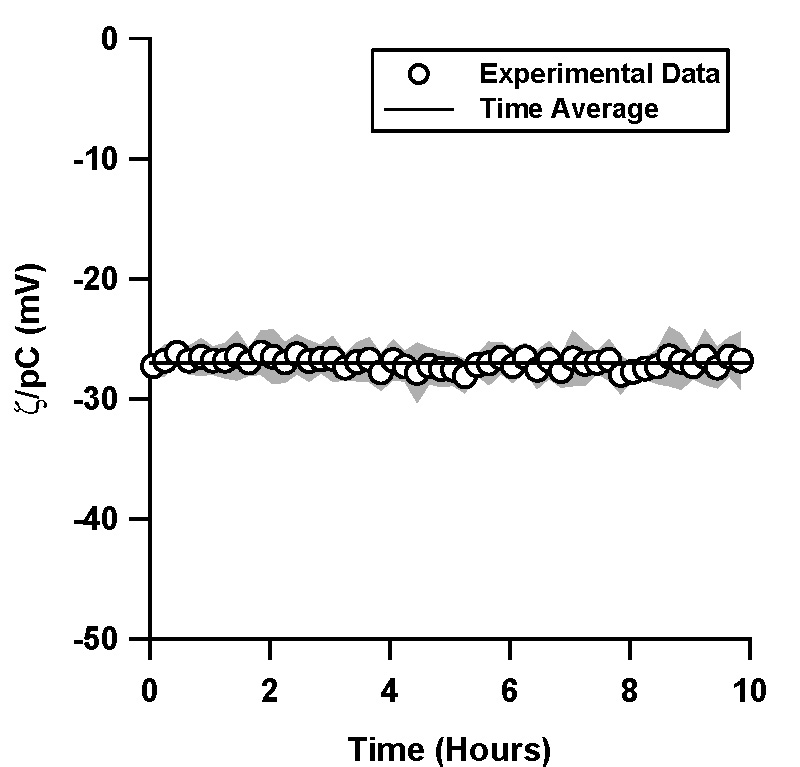
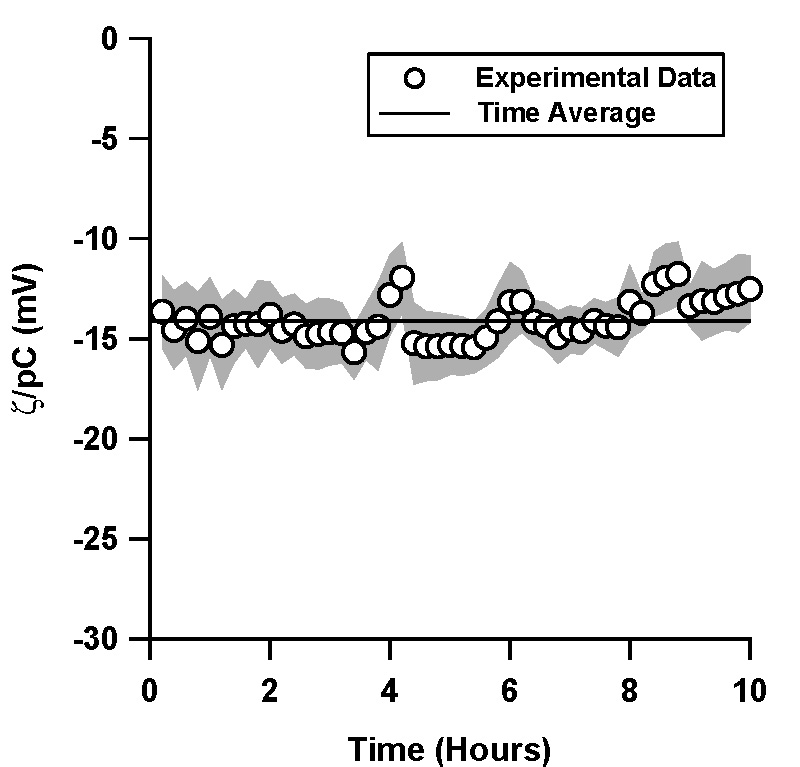
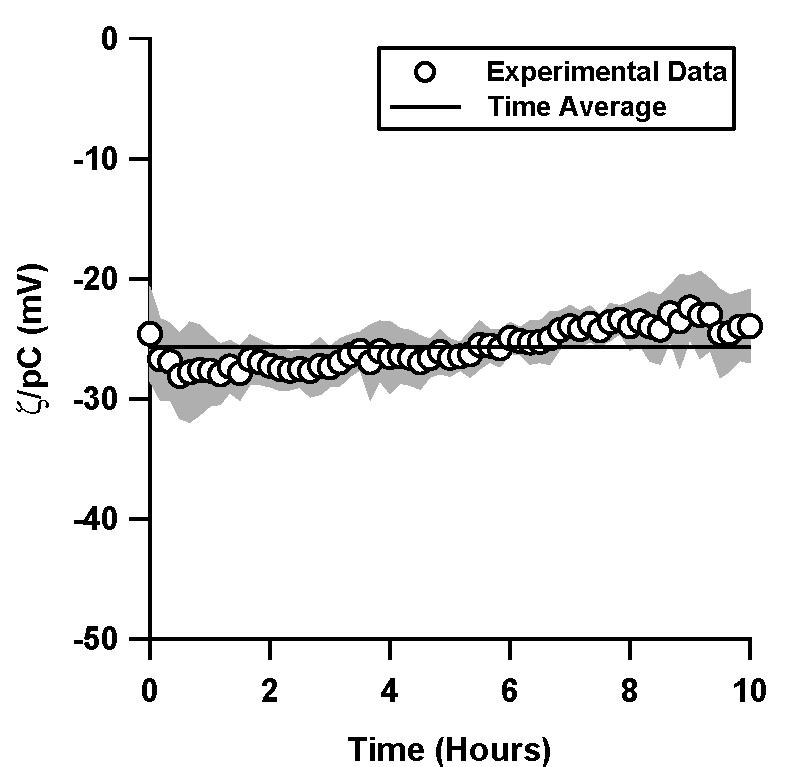
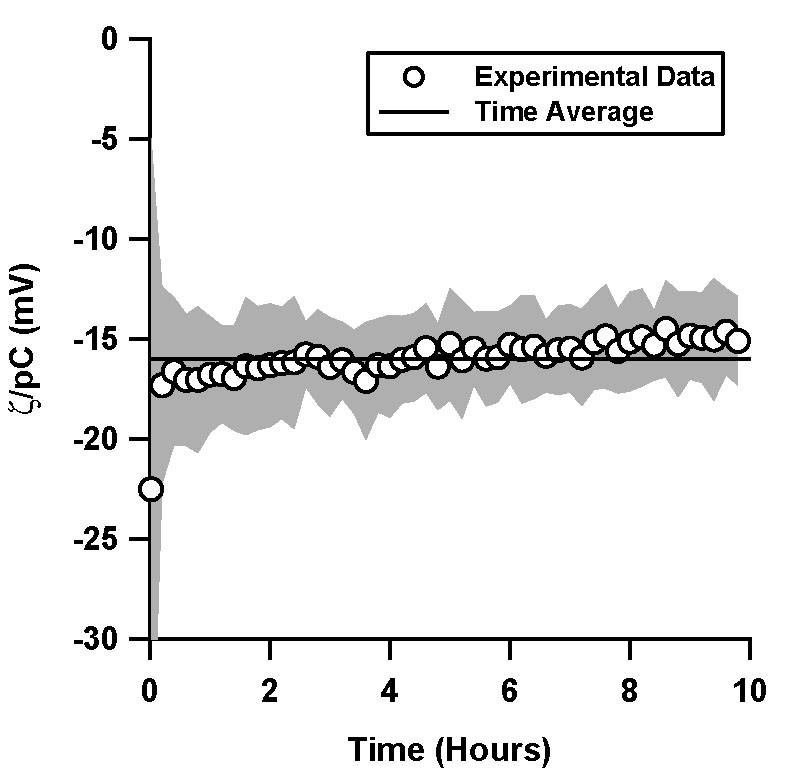
| Figure 1. Normalized ζ-potential, ζ/pC (pC = -log C, C is the counterion concentration in M) inferred from streaming potential measurements in pressure driven flow, as a function of time for (a) a TOPAS microfluidic channel with 1 mM, pH 7 phosphate buffer solution (4 trials), (b) a TOPAS microfluidic channel with 10 mM, pH 7 phosphate buffer solution (6 trials), and (c) in a silica microfluidic channel with 1 mM, pH 7 phosphate buffer solution (4 trials). The inset in (b) shows a comparison of the 1 mM and the 10 mM data for TOPAS. Data shown is an average of the independent trials, where the shaded region represents the standard deviation between the trials. | ||
|
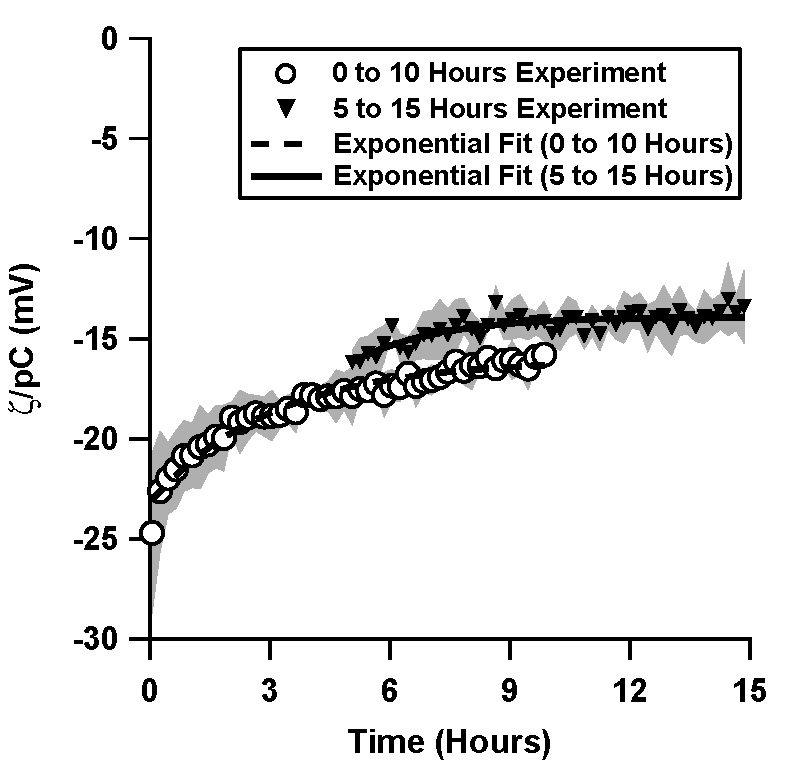
| Figure 2. Normalized ζ-potential, ζ/pC (pC = - log C, C is the counterion concentration in M) in a TOPAS microchannel inferred from streaming potential measurements in pressure driven flow after 5 hours of equilibration (the data was taken from 5 hours to 15 hours after the initial filling of the microchannel). The data is compared to the direct measurement (0 to 10 hours, Figure 1a). pH 7, 1 mM phosphate buffer solution was used. |
|
|
| (a) | (b) |
| Figure 3. Normalized ζ-potential, ζ/pC (pC = -log C, C is the counterion concentration in M) in electrokinetically driven flows as inferred via current monitoring in (a) TOPAS and (b) silica microchannels. pH 7, 10 mM phosphate buffer solution was used in both experiments. | |
|
| Figure 4. Normalized ζ-potential, ζ/pC (pC = -log C, C is the counterion concentration in M) as a function of time in a TOPAS microchannel under a pressure driven flow, as inferred via streaming potential. Flow was initially driven through the channel electroosmotically for 12 min. A pH 7 solution with 1 mM phosphate buffer was used. Data shown is an average of 4 independent trials, where the shaded region represents the standard deviation between the trials. |
|
|
| (a) | (b) |
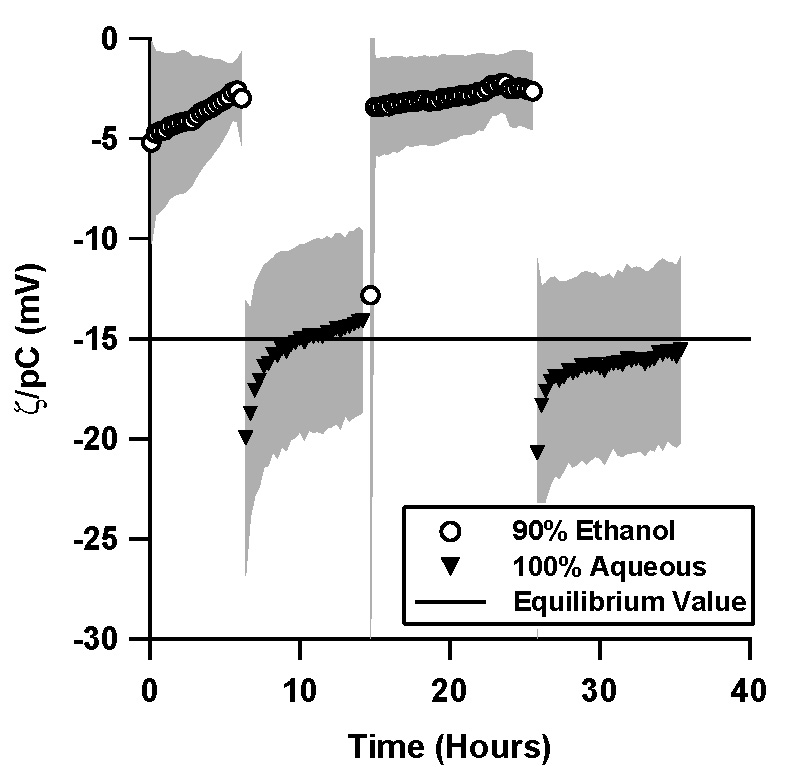
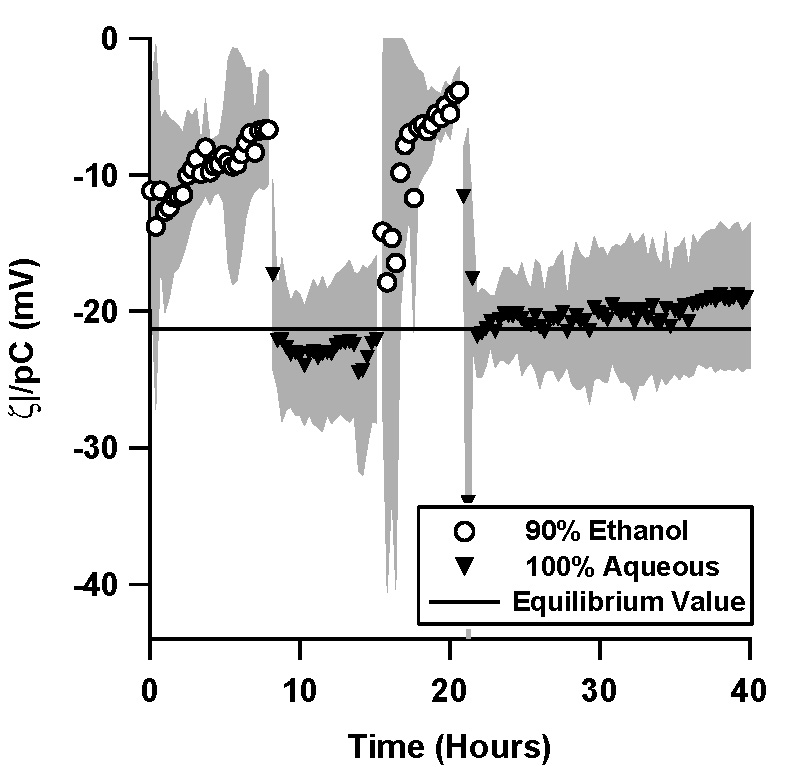
| Figure 5. Normalized ζ-potential, ζ/pC (pC = -\log C, C is the counterion concentration in M) as a function of time in (a) a TOPAS microfluidic channel, and (b) in a silica microfluidic channel. Data shown is an average of 4 independent trials, where the shaded region represents the standard deviation between the trials. | |
An ethanol solution was driven through a TOPAS microchannel via pressure, and the resulting streaming potential signal was measured for a minimum of 6 hours. An aqueous, 1mM, pH 7 phosphate buffer was then flushed through the microchannel, flow actuated with the same pressure waveform, and the streaming potential monitored again for a minimum of 6 hours. An additional ethanol cycle and an additional aqueous cycle followed in the same fashion.
Whenever the aqueous solution replaced the ethanol solution as the solvent, there was an initial transient in which the magnitude of the apparent ζ-potential was initially high, with a normalized value of -22 mV (Figure 5a). The ζ-potential magnitude variation during the aqueous cycles is well fit by exponential decays, with a normalized equilibrium value of -14.5 mV and a time constant of 1.5 hours for the first aqueous cycle; -15.8 mV and 3.0 hours for the second aqueous cycle.
Similar transients were not observed during the aqueous cycles in silica microchannels (Figure 5b).