Reports: B6
46865-B6 Dissecting the Dynamics of Surfactant Assemblies with Numerical Fluorescence Correlation Spectroscopy
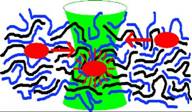
Numerical Fluorescence Correlation Spectroscopy (NFCS) follows the general protocol established for traditional Fluorescence Correlation Spectroscopy (FCS), but replaces analytical modeling with two numerical features: (1) a numerical map of the detection volume; (2) a computer simulation that produces correlation curves for scenarios that are difficult or impossible to model analytically. Analytically challenging scenarios are ubiquitos, such as diffusion in or around vesicles, or nanoscale corrals on polymer-coated surfaces.
 Diffusion within and around nanoconfined
spaces is difficult to interpret with traditional FCS due to the small
geometric constraints imposed on the fluorescent tracers. The approach under
development in our lab allows investigation of nearly any geometric scenario by
building obstacles or other diffusion constraints into the simulation
code. Thus, the simulator is able to
distinguish diffusive components in FCS data that would normally be difficult
to interpret.
The second year of activity involved applying our numerical simulations to polyelectrolyte multilayer surfaces and to dye molecules encapsulated in liposomes:
(1) We completed work on a set of simulations investigating the reproducibility of diffusion in polyelecrolyte multilayer thin films. Results from this work have been published in Langmuir.
(2) We implemented cumulant concentration analysis. When the number of molecules and the calculation threshold are set such that the simulation (and calculation) space is at least four times the e-2 radius of the detection volume, the internal motion of the dye in the vesicle scenario does not significantly bias the cumulant concentration analysis, in the average, for 100-nm (diameter) vesicles. Cumulant concentration calculation had a small amount of bias for 200-nm (diameter) vesicles (about 5%). The bias increases significantly (to about 12%) for 400-nm (diameter) vesicles (laser R = 688 nm).
(3) Results from this analysis have been combined with experimental measurements performed at NIST and submitted for publication.


