Reports: AC5
48701-AC5 Nanoparticle Layer-by-Layer Assembly for Fuel Cell Electrodes
We report a synthesis technique that yields stable, mono-disperse molecular clusters of platinum monomers in colloidal suspension with high electrocatalytically active surface area based on the adsorption and desorption of protons in acidic media that are free from site specific interactions with a support structure. Specifically, we reduce a platinum precursor with a stannous salt through the formation of an oxidant-reductant complex and subsequent removal of the reducing agent according to Scheme 1.
(Pt-Sn)complex → Ptmetal + 2Sn4+ + xSn2+
Scheme 1: Platinum Reduction
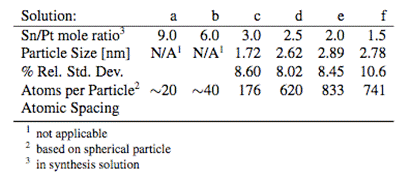
where x describes the stannous ions that are not oxidized by platinum, are ejected from the complex, and remain attached to the reduced particles' surface. Particle size can be reliably manipulated by controlling stannous to platinum ion ratio. The particle sizes obtained via TEM analysis of not less than 100 particles appear in Table 1. All of the solutions result in the formation of stable colloidal suspensions of particles except for solutions e and f. Particle agglomeration occurred during precursor decomposition; solution f began to agglomerate approximately 10 minutes into decomposition while solution e began to agglomerate at the end of particle decomposition as the heat was removed. In order to preserve the solutions for TEM analysis, the excess stannous chloride was immediately added to protect the remaining nanoparticles. The data are included here for completeness.
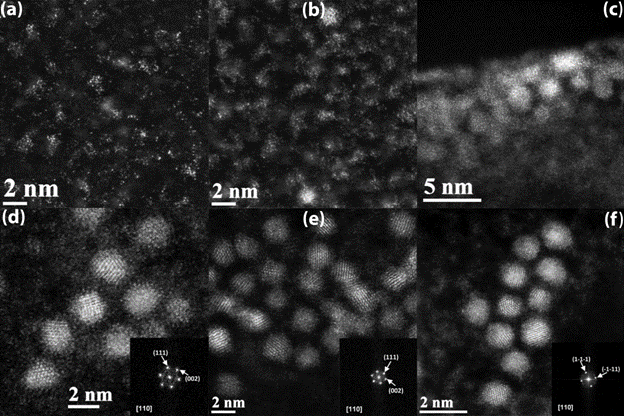
Figure 1 (a-f) shows the HAADF STEM images of the Pt particles with decreasing Sn2+/Pt4+ ratio in the solution. A clear transition of the Pt morphology is visible in Fig 1a with well distributed single Pt atoms to Fig 1f having Pt crystals of 2.9nm diameter. This was confirmed by indexing the lattice fringes with FFT as shown in Fig 1 d-f. All the FFTs correspond to a [110] zone axis of face-centered Pt crystals with a lattice parameter of 3.923 Å. In this way, the particles represented in this series of images clearly illustrate monomer-to-cluster-to-crystal transformation of platinum ion in solution. Cleveland et al. (1) and Ward et al. (2) demonstrated similar structures for gold and platinum-ruthenium bimetallic systems, respectively, where there are three regimes for the transition from molecular-to-crystalline structures: regime 1) Pt0 atoms coalesce to form molecular structures of associated individual atoms, so-called molecular clusters (Figures 1a-b); regime 2) the coalesced molecular structures continue to grow into ordered, non-crystalline particles (Figure 1c); and regime 3) the non-crystalline particles transition to more-ordered, crystalline particles (Figures 1d-f). Furthermore, the transition between these structures occurs at similar sizes: approximately 40 atoms for the transition from regime 1 to 2 and approximately 250 atoms for the transition from state 2 to 3. The TEM images show clearly that as particle size decreases beneath a certain threshold crystallinity disappears and the particles more closely resemble individual-atomic than bulk-metal structures.
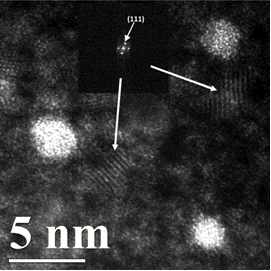
Figure 2 shows the HAADF-STEM image of solution with a Sn2+/Pt4+ ratio of 1.50. Early Pt atomic cluster formation is evident in the three particles shown in the image. A different phase is also visible at the background surrounding the three Pt clusters. A detailed analysis of the lattice fringes by FFT indicates the second phase to be stannous chloride (SnCl2). This indicates the added stannous chloride does form a protective layer on the Pt clusters preventing the oxidation of the stannous ion sheath.
Several noticeable features are seen in the STEM images of the crystalline particles. Some of these particles exhibit a half-crystalline and half-amorphous structure. This is an indication of the progressive orientation of the Pt atoms in the clusters towards more stable crystal structure. This phenomenon is perhaps most visible in Figure 1f, but can be found in Figures 1d-f. For the largest particles (those in Figure 1e) there is apparently a preferred crystallographic arrangement of atoms as most of the crystals show (111) lattice fringes as seen from the FFT analysis. Secondly, Figure 1a and b show not only the early onset of cluster formation, but also the existence of reduced platinum atoms that have yet to attach to a cluster. This solution was stable indicating that the reduced platinum monomers are complexed by SnCl42- ligands. As the Sn2+/Pt4+ ratio nears the stoichiometric ratio for the (Pt-Sn)complex, the particle size dramatically increases and the transition to a defined crystal begins. Although, the particles in Figure 1d are distinct, but they lack a well-formed, predominate crystal structure.
The TEM images illustrate that as the particles grow in size there is a compaction of the lattice so that atomic spacing decreases with increasing size. For bulk platinum, the lattice parameter is 3.920 Å. The atomic spacing for the structures here are summarized in Table 1. Next Steps. Challenges
1. Electrolyte purity must be improved for an accurate assessment of active surface area, mass activity, exchange current density (~ 10-6A), and Tafel slope. This will represent a significant capability achievement for our laboratory
2. Tin removal from the nanoparticle surface in order to reveal the active platinum.
3. Further structural analyses (SANS and SAXS) of LbL assembled electrodes for a comprehensive understanding of the nanoparticle and electrode structures.
4. Durability assessment. References
1. C. Cleveland, et al., Phys. Rev. Lett. 79, 1873 (1997).
2.
E. Ward, Table 1. Particle Size of Synthesized Nanoparticles
Figure 1: HAADF-STEM micrographs of platinum nanoparticles synthesized from a reducing Sn(II)/Pt(IV) ratio in solution as indicated in Table 1. Particle size and crystallinity increases progressively as the Sn(II)/Pt(IV) ratio falls from 9 to 1.5. (inset) The Fourier transforms of the Pt crystalline particles. Figure 2: HAADF-STEM micographs of platinum nanoparticles synthesized from a Sn(II)/Pt(IV) ratio of 2.5 in solution. Note the existence of a second phase at the background surrounding the Pt clusters. Calculation shows the second phase to be stannous chloride. (inset) The Fourier transform of the second phase. 


