Reports: AC8
48115-AC8 Quantifying the Links between Geophysical and Geochemical Properties of Organic-Rich Shales
Organic-rich shales are intrinsically heterogeneous and complex rocks comprising an inorganic framework in which organic matter may be dispersed in different amounts. Geochemical characterization of the kerogen dispersed in organic-rich shales has been extensively used to quantitatively discriminate the type and maturity of the kerogen-constituting macerals. However, we still lack fundamental relationships relating the maturity of the organic fraction and the rock-physics properties used to support seismic exploration.
In this project, a comprehensive laboratory study on organic-rich shales was undertaken to understand how properties such as maturity expressed as vitrinite reflectance controls seismic wave propagation and anisotropy. Kerogen maturity has been previously expressed in terms of Hydrogen Index (HI) – and by proxy, kerogen type—when relating the maturity of organic-rich rocks to rock physics properties. However, it has been shown that HI mostly expresses the hydrocarbon generative potential (HGP) and the quality of a source rock (i.e. oil prone vs. gas prone) which are both function of the kerogen-constituting maceral types. As a consequence, the use of HI alone can be ambiguous since low HI values are not unequivocally related to maturity but rather to the probable origin of maceral types within each maceral group. We present a relationship between maturity, expressed in terms of Vitrinite reflectance and the anisotropic Thomsen's parameter. Then, we complemented traditional rock-physics measurements with the analysis of images obtained via confocal laser scanning microscopy (CLSM). The ultimate goal is twofold: 1) understanding how maturation processes changing the spatial arrangement of kerogen control the elastic properties of organic-rich shales; 2) exploring suitable techniques to image organic matter that are relevant for rock physics computational analysis.
Figure
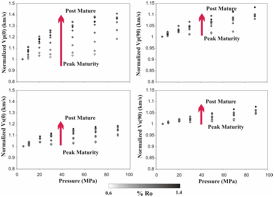
1 plots bedding-normal and -parallel P- and S-wave velocity for a
suite of organic shales measured under room dry
conditions. Data are color-coded in terms of vitrinite
reflectance (% Ro). Figure 1 shows that early-mature shales (% Ro, 0.60-0.65) have lower
P-velocity sensitivity to pressure than post-mature shales
(% Ro > 1.35), showing a possible cause-effect relation between crack
formation and velocity sensitivity to pressure over maturity. However,
these mechanisms would be shared alike by the whole dataset. The
sensitivity of S-wave velocity to pressure seems to be less affected by kerogen maturation in both the bedding-normal and -parallel
directions.
Figure 1: Normalized bedding-normal (left) and
-parallel (right) P- and S-wave velocity as a function of confining pressure.
Data are color-coded in terms of vitrinite reflectance
(% Ro).
The
dependence of anisotropy on maturity becomes more complex as data from samples
lying in the immature-to-early-mature range are added to the trend.
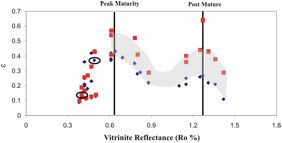
Figure 2: The anisotropic Thomsen's parameter, e, as a function of vitrinite reflectance (%Ro) for samples measured under
50MPa (blue diamonds) and 5MPa (red diamonds) confining pressure. Black circles
highlight Monterey and Woodford samples used for Confocal
Laser Scanning Microscopy.
Figure 2 plots the anisotropic Thomsen's parameter, epsilon,
as a function of vitrinite reflectance for samples
spanning a larger maturity range (i.e from immature
to post-mature) and measured under confining pressures of 50MPa (blue diamonds)
and 5MPa (red diamonds). Figure 2 shows that data measured under pressure
conditions of 50MPa and 5MPa follow a similar trend. The inception of the
maturity peak (Ro % = 0.65) separates the pressure-dependent anisotropic
behavior of these rocks: for maturities less than 0.65 (from immature to peak
mature rocks), rocks exhibit a low pressure-sensitivity (velocity and
anisotropy) but increasing magnitude of anisotropy with increasing Ro%; for
maturities greater than 0.65, rocks show an higher sensitivity of velocity to
pressure and decreasing magnitude of anisotropy.
Such results
raise the following considerations:
-
Micro-cracks undoubtedly play a role beyond the peak-maturity stage, as the
offset (gray area) between the anisotropy values measured at different
pressures increases as a function of vitrinite
reflectance. Nevertheless, the low
pressure sensitivity of velocity associated with high anisotropy in immature
and early-mature rocks and the fact that the anisotropy trend is maintained
even at 50 MPa pressure conditions suggest the
existence of mechanisms inducing anisotropy other than micro-crack alignment;
-
Mechanisms generating intrinsic anisotropy are related to processes related to
the compositional and structural changes associated with geochemical
transformations of the kerogen occurring during
maturation.
As a
consequence, techniques that help us understand how maturation processes change
the spatial arrangement of kerogen within the
inorganic frame will provide strong insight into the effects of maceral distribution on the elastic properties of
organic-rich shales, and thus help us predict
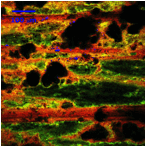
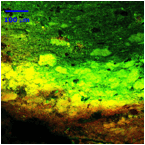
maturity from seismic data. Figure 3a (left) and Figure 3b (right) show
fluorescence images obtained using CLSM for Monterey (Ro % = 0.38) and Woodford
(Ro % = 0.49) organic-rich samples. Monterey samples are characterized by a
strong natural fluorescence of the liptinite group as
well as a very fine lamination perpendicular to the bedding plane. Lamination thickness
seems to increase for Woodford samples, probably in relation to maturity, and
thus to the compositional transformations affecting macerals.
However, further analyses are required to confirm this mechanism.
Figure 3: Fluorescence images obtained via CLSM for
(left) Monterey (Ro % = 0.38) and (right) Woodford (Ro % = 0.49) organic-rich
samples. Size and resolution of images are 636 mm and
1024×1024 pixels, respectively. Images are taken perpendicularly to the
plane-bedding.
The results indicate that anisotropy in organic-rich shales shows a complex variation over maturity. This
variation and the compositional changes affecting vitrinite
reflectance with maturation follow interestingly similar trends, suggesting
that the observed phenomena may have a common origin. Imaging techniques like
CLSM may provide powerful tools for identification of different organic
components and their spatial arrangement such as micro-geometries of
hydrogen-rich kerogen distribution. These images are
obtained much faster than traditional geochemical analyses of kerogen content and can be used as inputs to estimate bulk
properties and expand existing shale databases.


